In today’s economy, rising disposable income and reduction in taxes have led to increased household savings, thereby driving the growth in the FMCG sector. With this, the food processing industry in India is expected to reach USD 547 billion by FY28 and from 2022–2028, it’s expected to grow at a CAGR of 9.5%.
Many companies operate in this segment and are seeking to capitalise on this growth by improving their distribution networks, specifically in tier 2 and 3 cities. Among them, two giants are Hindustan Unilever and Colgate-Palmolive Ltd.
Let us dive deep into this blog and make a comparison of Colgate-Palmolive vs Hindustan Unilever to understand the business and financials of both companies and figure out which is better.
Also Read: Leela Hotels IPO 2025: Key dates, details
FMCG industry overview
The Fast-Moving Consumer Goods (FMCG) industry in India has witnessed significant growth and continues to expand rapidly due to a boost in consumer goods demand. Additionally, the growth of delivery services has further accelerated fast-moving consumer goods. FMCG industry sales worth increased by 10.6% in Oct-Dec 2024, mostly on price-led growth and festive season.
Rural markets are currently outperforming urban markets, with rural consumption increasing 9.9% during the December quarter compared to 5% growth in urban areas. Rural consumers saw a nearly 60% hike in average FMCG basket size from 5.8 in 2022 to 9.3 by 2024. Rural households play an important role, contributing 35-36% of India’s FMCG market.
India’s online grocery market is also expected to grow from USD 4,540 million in 2022 to US$ 76,761 million by 2032 at a healthy CAGR of 32.7%.
Hindustan Unilever overview
Hindustan Unilever operates in the FMCG business mainly comprising home care, beauty & personal care and foods & refreshment segments in demand nowadays. The company operates manufacturing facilities nationwide and peddles stuff mainly within India and has a collection of more than 50 FMCG brands.
As of March 2025, the company saw a 45% gross sales value growth in its e-commerce portfolio and doubled its assortment in quick commerce (Q-com) channels. It also covers 125,000+ speciality stores through a customized route-to-market approach in FY25.
Colgate-Palmolive India overview
Colgate-Palmolive India Ltd manufactures and trades various personal care products including toothpaste, toothpowder mouthwash and toothbrushes fairly extensively nowadays.
The company has prioritised superior product experiences by launching innovations such as toothpaste with arginine plus calcium boost technology. The brand continues to maintain robust consumer metrics, with 83% of respondents viewing Colgate as an oral care expert.
Colgate has aggressively expanded its rural footprint, doubling the number of villages reached compared to the previous year. Direct-to-door (D2D) activations reached 4.4 million households, leading to a 33% increase in brand penetration in focus geographies.
Also Read: CG Power stock analysis & expert insights in detail
Financial Performance
Let us have a look at financial performance of Colgate & Hindustan Unilever for the financial year 2024-2025:
| Metrics (In ₹ Crore) | Colgate-Palmolive (India) Ltd | Hindustan Unilever Ltd |
| Revenue | 6,040 | 63,121 |
| EBITDA | 1,958 | 14,843 |
| EBITDA Margin | 32% | 24% |
| Net Profit | 1,437 | 10,671 |
| Net Profit Margin | 23.79% | 16.91% |
| EPS (In ₹) | 52.83 | 45.32 |
| Dividend | 97% | 117% |
| PE Ratio | 47.0x | 53.1x |
| Debt to Equity Ratio | 0.04 | 0.03 |
| ROE(%) | 81.20% | 20.70% |
1. Revenue
Revenue is the total income generated from a company’s business operations. Colgate-Palmolive reported a revenue of ₹6,040 crore and Hindustan Unilever reported a higher number of ₹63,121 crore. Under this metric Hindustan Unilever leads and this difference is majorly due to Hindustan Unilever’s vast product portfolio compared to Colgate’s more focused oral care segment.
2. EBITA and EBITDA Margins
EBITDA reflects the company’s operational profitability before accounting for interest, taxes, depreciation, and amortization. Colgate-Palmolive gave an EBITDA of ₹1,958 crore with a margin of 32% and Hindustan Unilever, with an EBITDA of ₹14,843 crore and a margin of 24%. Under this metric, Colgate leads with higher margins, as operating a single segment requires less expense, unlike Hindustan Unilever, which has more than 50 brands.
3. Net Profit and Net Profit Margins
Net profit shows the profit at the very end after costs have been subtracted. Colgate-Palmolive posted ₹1,437 crore in net profit which is a net profit margin of 23.79% and Hindustan Unilever reported higher net profit at ₹10,671 crore but has a margin of 16.91%.
4. EPS
EPS, also known as earning per share indicates the profit made after each outstanding share. Colgate-Palmolive reported a higher EPS of ₹52.83 compared to Hindustan Unilever’s ₹45.32.
5. Dividend
In terms of shareholder returns through dividends, Hindustan Unilever takes the lead with a declared dividend of 117%, compared to Colgate-Palmolive’s 97%.
6. PE Ratio
The Price-to-Earnings (PE) ratio helps assess how expensive a stock is relative to its earnings. Colgate has a PE of 47.0x, while Hindustan Unilever’s is slightly higher at 53.1x. With the industry PE at 56.6x, Colgate appears relatively lower in valuations by comparison.
7. Debt to Equity Ratio
Debt to equity measures the debt of a company in comparison to its equity. Both companies maintain very low debt levels, reflecting financial discipline. However, Hindustan Unilever slightly edges out with a lower debt-to-equity ratio of 0.03 compared to Colgate’s 0.04 and leads under this metric.
8. ROE
ROE which is return on equity measures how much returns investors have gained against the equity of the company. Colgate-Palmolive is a standout in ROE, delivering a massive 81.20% return compared to Hindustan Unilever’s 20.70%.
Let us have a look at the summary of all the metrics:
| Metrics (In ₹ Crore) | Colgate-Palmolive (India) Ltd | Hindustan Unilever Ltd |
| Revenue | 👎 | 👍 |
| EBITDA Margin | 👍 | 👎 |
| Net Profit Margin | 👍 | 👎 |
| EPS (In ₹) | 👍 | 👎 |
| Dividend | 👎 | 👍 |
| PE Ratio | 👍 | 👎 |
| Debt to Equity Ratio | 👎 | 👍 |
| ROE(%) | 👍 | 👎 |
| Stock Performance | 👍 | 👎 |
Stock Market Performance
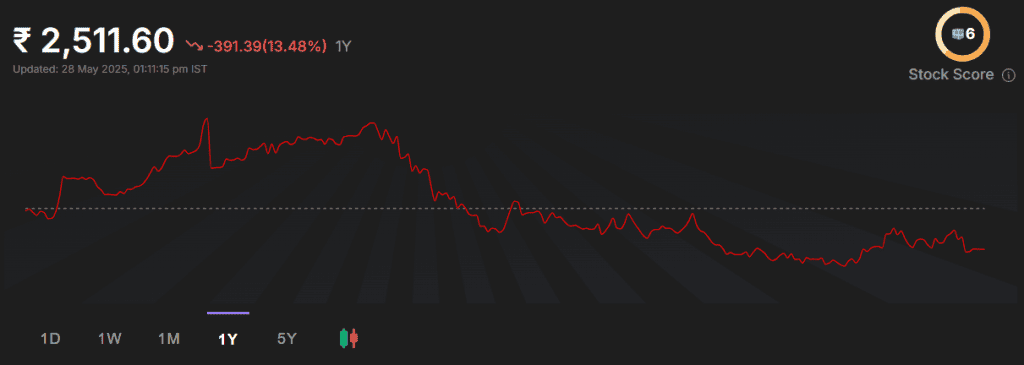
Colgate-Palmolive Ltd is currently trading at a price of ₹2,474 as of 23 May 2025. Further, the stock has made a 52-week high and low of ₹3,893 and ₹2,312, respectively.
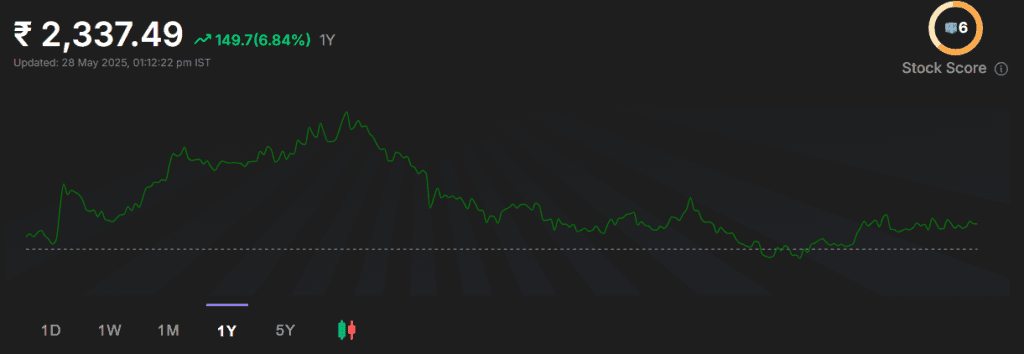
Hindustan Unilever Ltd is currently trading at a price of ₹2,359 as of 23 May 2025. Further, the stock has made a 52-week high and low of ₹3,035 and ₹2,136, respectively.
| Returns (As of 23 May 2025) | Colgate Palmolive Ltd | Hindustan Unilever Ltd |
| 1 Month | -3.76% | -3.80% |
| 6 Months | -7.84% | -0.99% |
| 1 Year | -8.77% | -0.98% |
| 5 Years | 93.97% | 19.28% |
Based on the data, Colgate-Palmolive Ltd has shown comparatively stronger long-term performance than Hindustan Unilever. Both companies have had some ups and downs recently, but Colgate stands out when we look at the last 5 years.
In the past 1 month, both stocks went down slightly, Colgate fell by 3.76%, and HUL by 3.80%. Over 6 months, Colgate dropped more sharply by 7.84%, while HUL lost only 0.99%.
Over the past year, Colgate fell 8.77%, and HUL was almost flat, down just 0.98%.
Over the past 5 years, Colgate-Palmolive delivered a return of 93.97%, compared to 19.28% by HUL. Although Colgate experienced some short-term declines, its long-term performance has been comparatively stronger.
Also Read: Adani Green vs Tata Power: Who leads the charge in India’s evolving power sector?
Bottomline
Colgate and Hindustan Unilever are key players in India’s booming FMCG sector, each excelling in different areas. Hindustan Unilever is leading in revenue, dividend, and lower debt, whereas Colgate leads in majority metrics like EBITDA, net profit margins, EPS, PE ratio, ROE, and stock returns. Ultimately, the better pick depends on the personal goals and risk-taking ability of the particular investor.