What Is a Cup and Handle Pattern?
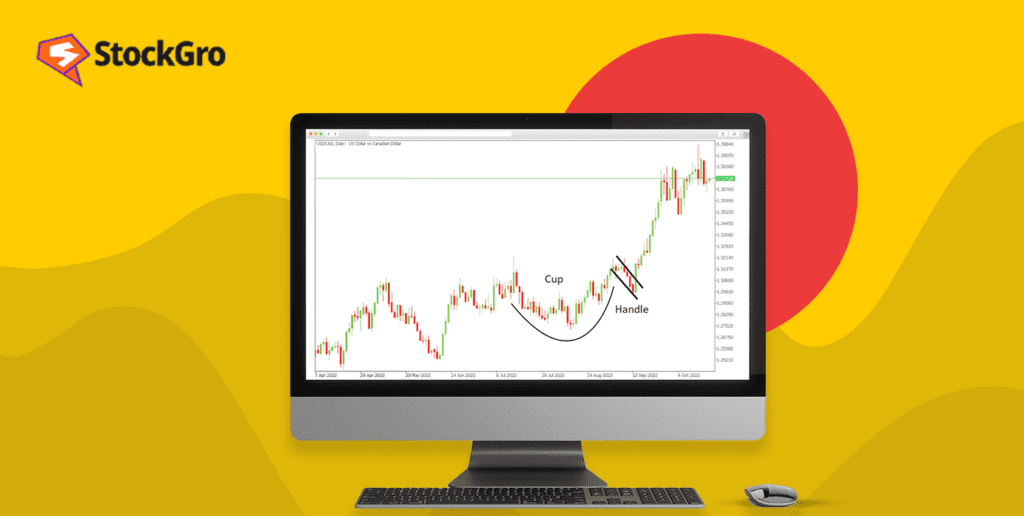
The Cup and Handle pattern is a well-known bullish continuation chart pattern used in technical analysis to identify potential breakout opportunities. It resembles the shape of a tea cup, where the rounded “cup” represents a recovery phase and the smaller “handle” reflects temporary consolidation before a breakout.
This pattern generally appears after an existing uptrend and signals that the stock may continue moving higher after a short pause. It reflects a gradual shift where sellers lose momentum and buyers regain control.
Traders prefer the Cup and Handle pattern because it provides:
- Clear breakout levels
- Defined stop-loss placement
- Structured target estimation
- Strong risk-reward opportunities
The pattern is widely used in equities, indices, commodities, and even crypto markets.
Formation of the Cup and Handle Pattern on Charts
The pattern develops in two phases — the cup formation and the handle formation.
The cup forms when price declines gradually from a previous high, stabilises, and then recovers back toward the earlier resistance level. This creates a rounded “U” shape. A rounded bottom is considered healthier and more reliable than a sharp “V” reversal because it indicates controlled accumulation.
After the cup formation, the stock enters a smaller consolidation phase called the handle. The handle generally drifts sideways or slightly downward due to short-term profit booking before the breakout occurs.
Volume behaviour is also important during formation:
- Volume generally decreases during cup formation
- Volume contracts further during the handle
- Volume rises sharply during breakout
This increase in breakout volume confirms stronger buying participation.
Guidelines for Identifying the Cup and Handle Pattern
A proper Cup and Handle pattern should begin with a clear prior uptrend. Without a bullish trend already in place, the breakout may not sustain.
The cup should ideally form a smooth rounded structure. Sharp recoveries often indicate volatility instead of genuine accumulation. The handle should remain relatively shallow compared to the cup depth.
Key characteristics traders look for include:
- Rounded “U” shaped cup
- Smaller handle consolidation
- Breakout above resistance
- Strong volume confirmation
- Stable broader market conditions
The longer the pattern takes to form, the stronger the breakout potential is generally considered.
How to Trade with the Cup and Handle Pattern
Traders usually enter the trade once the stock price breaks above the resistance level formed near the cup rim. This breakout signals that bullish momentum is returning.
Entry Point:
Buy when price closes above the breakout level with strong volume support.
Stop-Loss Placement:
Stop-loss is generally placed below the handle low or recent support area.
Target Formula:
Target Price = Breakout Level + Cup Depth
Example:
- Cup resistance = ₹700
- Cup bottom = ₹620
- Cup depth = ₹80
If breakout occurs at ₹700:
Target = ₹700 + ₹80 = ₹780
This formula helps estimate the expected price movement after breakout.
Trading Strategies
Breakout Entry Strategy: This is the most commonly used approach. Traders enter immediately after price closes above resistance. Strong breakout volume improves reliability and reduces chances of failure.
Retest Strategy: Some traders wait for the stock to retest the breakout level before entering. If previous resistance acts as support, it confirms breakout strength and provides a lower-risk entry.
Volume Confirmation Strategy: Volume plays a critical role in validating the breakout. A breakout with rising volume indicates stronger institutional participation and better continuation probability.
Swing Trading Strategy: The Cup and Handle pattern is widely used in swing trading because breakouts often lead to medium-term trends lasting several days or weeks.
Momentum Confirmation Strategy: Many traders combine the pattern with RSI, MACD, or moving averages. If momentum indicators also turn bullish, the trade setup becomes stronger.
Pullback Buying Strategy: Instead of chasing the breakout candlestick, some traders wait for a small pullback after breakout. This improves risk-reward ratio and reduces emotional buying.
Multi-Timeframe Strategy: Professional traders often analyse the pattern across daily and weekly charts together. A breakout supported by higher timeframe trends carries greater reliability.
Example of the Cup and Handle Pattern: Suppose a stock rises from ₹500 to ₹680 and then corrects gradually to ₹600 before recovering back to ₹680. This creates the cup structure.
The stock then consolidates between ₹660 and ₹680, forming the handle. Once price breaks above ₹680 with strong volume, the pattern gets confirmed.
Target Calculation:
Target = Breakout Level + Cup Depth
= ₹680 + (₹680 − ₹600)
= ₹680 + ₹80
= ₹760
This becomes the estimated upside target after breakout confirmation.
Advantages and Disadvantages of the Cup and Handle Pattern
Advantages
Easy to Identify: The Cup and Handle pattern has a visually clear structure, making it relatively easy for traders to recognise on charts.
Provides Defined Entry and Exit Levels: The pattern offers clear breakout, stop-loss, and target zones. This improves trade planning and risk management.
Strong Bullish Continuation Signal: It often appears during healthy uptrends and signals continuation after consolidation. This makes it highly popular among momentum traders.
Works Across Multiple Timeframes: The pattern can be used in intraday, swing, and long-term trading setups. However, higher timeframe patterns are generally more reliable.
Volume Confirmation Enhances Reliability: Breakouts supported by strong volume tend to sustain longer. This increases confidence in the setup.
Disadvantages
False Breakouts Can Occur: Not every breakout succeeds. Some stocks briefly cross resistance before reversing sharply.
Requires Patience: The pattern can take weeks or months to form properly. Traders looking for quick setups may struggle with the waiting period.
Weak Volume Reduces Reliability: Breakouts without strong volume confirmation are more likely to fail.
Less Effective in Bearish Markets: The pattern works best in bullish environments. During weak market conditions, breakouts may struggle to sustain.
Can Be Misidentified Easily: Traders sometimes mistake random rounded consolidations for valid Cup and Handle formations, leading to poor decisions.
Reverse Cup and Handle Pattern: The Reverse Cup and Handle is the bearish variation of the standard pattern. Instead of signalling bullish continuation, it indicates potential downside continuation.
In this setup:
- The cup forms an inverted “U” shape
- The handle forms a short upward consolidation
- Breakdown below support confirms bearish momentum
Traders use this pattern to identify short-selling opportunities or bearish continuation trades.
Target Formula:
Target = Breakdown Level − Cup Depth
Example:
- Breakdown level = ₹500
- Cup top = ₹580
- Cup depth = ₹80
Target = ₹500 − ₹80 = ₹420
This gives the estimated downside target after breakdown.
Know more types of candlestick patterns here.
Bottom Line
The Cup and Handle pattern is one of the most widely followed bullish continuation patterns in technical analysis. It helps traders identify breakout opportunities with defined targets and stop-loss levels.
However, no chart pattern guarantees success. Confirmation through volume, broader trend direction, and risk management remains essential.
When used correctly with proper analysis and discipline, the Cup and Handle pattern can become a highly effective tool for momentum-based trading strategies.
FAQ’s
Yes, it is generally considered a bullish continuation pattern that signals potential upside breakout after consolidation.
The pattern works across multiple timeframes, but daily and weekly charts are usually more reliable.
Yes, strong breakout volume increases the reliability of the setup and confirms buying momentum.
Yes, it is beginner-friendly because it offers clear breakout levels, targets, and stop-loss placement.
No, false breakouts can occur. Proper confirmation and risk management are always necessary.
The target is generally calculated by adding the cup depth to the breakout level.
Yes, especially in weak or volatile markets. Traders should always use stop-loss protection.
It is the bearish version of the pattern that signals possible downside continuation after a breakdown.