
India’s growth story has taken a new direction in recent years. The country’s GDP –Gross Domestic Product– has grown from $1.9 trillion to $3.6 trillion. In 2024, it moved past the UK to become the fifth-largest in global rankings.
Looking ahead, the aim is to reach $30 to $35 trillion in value by 2047. For this, the contribution of core industries will be critical. One of them is pharmaceuticals.
This sector ranks among the top five in manufacturing GVA (Gross Value Added). It brings in 4% of foreign direct investment. It also sustains close to 2.7 million livelihoods across the country.
In global markets, Indian pharma companies continue to strengthen their presence. The country runs a healthy trade surplus of about $19 billion in this space.
Among the names leading this charge are Dr Reddy’s Laboratories and Sun Pharmaceuticals. This piece compares how each is positioned, what they offer, and what their numbers reveal. In this blog let us compare Dr Reddy vs Sunpharma in a detailed manner.
India’s Pharma Industry
India is often referred to as the “Pharmacy of the World.” India holds the third position worldwide in pharmaceutical production by volume and ranks fourteenth in terms of value. This industry is supported by a huge network of over 10,500 manufacturing units and around 3,000 pharmaceutical companies, some of which are also USFDA certified and recognised by international bodies.
One of the vital plus points of this sector is its strong export performance. In FY24, the sector exported drugs and pharmaceuticals worth USD 27 billion, accounting for more than 20% of the world’s generic medicines.
With increasing demand in both global and domestic markets, the Indian pharmaceutical sector is expected to grow at a very strong pace. It is estimated that the market size of this industry could reach USD 130 billion by FY30 and USD 450 billion by FY47.
Also Read: Mankind Pharma stock analysis and expert insights in detail
Company Snapshot
Let us have a look at the company overview of both firms and try to understand their business.
Dr Reddy’s Laboratories
Dr Reddy’s Laboratories is a prominent global pharmaceutical company based in India, specialising in affordable and innovative medicines. The company offers a mixed variety of products, which include generics, active pharmaceutical ingredients (APIs), biosimilars, and over-the-counter (OTC) drugs.
It serves markets such as the US, India, Russia, and other emerging economies, with a mission to promote the belief that “Good Health Can’t Wait.” Dr Reddy’s also focuses on sustainability, digital transformation, and patient-centred healthcare.
In Q3FY25, Dr Reddy strengthened its portfolio in India by introducing Toripalimab for nasopharyngeal carcinoma and Elobixibat for chronic constipation. Furthermore, Dr Reddy’s will be merging its Nicotine Replacement Therapy (NRT) business starting in April 2025, while maintaining its partnership with Haleon for distribution support to ensure a smooth transition.
Sun Pharmaceuticals Ltd
Founded in 1983, Sun Pharma has grown from humble beginnings to become one of the world’s largest players in the generic pharmaceutical industry and the largest in India. In the United States, it stands out as a top generic pharmaceutical company, particularly holding the second position in the generic dermatology segment by prescriptions.
Operating in over 80 markets worldwide, including key emerging economies like Brazil, Mexico, Russia, Romania, and South Africa, Sun Pharma is the largest Indian company in these regions. The company also has a strong presence in major markets across Western Europe, Canada, Australia, New Zealand, Japan, and China. With the extensive global footprint, Sun Pharma has been able to effectively cross-sell products and build robust brands in diverse markets.
Also Read: Case Study: Long-Term Gains from India’s Top Performing Stocks
Financial performance: Dr Reddy vs Sun Pharma
Let us take a look at the financial metrics of both companies as of Q3FY25
| Metrics (In ₹ Crore) | Dr Reddy’s Laboratories Ltd | Sun Pharmaceutical Industries Ltd |
| Revenue | 8,381 | 13,675 |
| EBITDA | 2,273 | 4,009 |
| EBITDA Margin | 27.12% | 29.32% |
| Net Profit | 1,404 | 2,913 |
| Net Profit Margin | 16.75% | 21.30% |
| EPS | 16.94 | 12.1 |
| Dividend | 12% | 34% |
| P.E. | 18.1x | 37.3x |
| ROE | 21.4% | 16.7% |
| New Product Launch | 2 | 16 |
| R&D | 666 | 845 |
| Debt to Equity | 0.16 | 0.01 |
1. Revenue
Revenue is the amount of sales a company makes in a year. In Q3FY25, Dr Reddy’s Laboratories had a revenue of ₹8,381 crore, where the major contribution came from Europe which was 142% up YoY.
Sun Pharmaceutical Industries had a higher revenue of ₹13,675 crore where U.S. sales declined 1% YoY to USD474 million, contributing over 30% to consolidated revenue. Growth in the specialty business offset weaker generics, including lower Lenalidomide sales.
Overall, Sun Pharma generated much higher revenue than Dr. Reddy’s, reflecting its larger scale and broader market presence.
2. EBITDA
EBITDA is an acronym for Earnings Before Interest, Taxes, Depreciation, and Amortization, it is a measure of a company’s operating profitability. Dr Reddy’s reported an EBITDA of ₹2,273 crore. The company achieved its EBITDA by maintaining its expenses at the same ratio, 72% of total revenue, consistent with both last year and this year.
In comparison, Sun Pharma reported an EBITDA of ₹4,009 crore. This EBITDA was achieved by reduction in the expenses compared to the previous year, which is a reduction of 120 basis points.
When we consider the EBITDA margin, i.e., EBITDA as a percentage of sales, Dr Reddy’s had a margin of 27.12%, just ahead of Sun Pharma’s 29.32%. The greater the EBITDA margin, the better the operating efficiency, hence Sun Pharma showed a slightly better performance.
3. Net Profit
Net profit is the last income after reducing all expenses and taxes. Dr Reddy’s had a net profit of ₹1,404 crore, and Sun Pharma had ₹2,913 crore. Further, Dr Reddy’s net profit margin was 16.94%, marginally higher than Sun Pharma’s 21.3%. This increase in profit margin is majorly due to a more 200 bps EBITDA margin of Sun Pharma compared to Dr Reddy’s Labs.
4. EPS
EPS is the measure of profit earned per outstanding share. Dr Reddy’s posted an EPS of ₹16.94 compared to Sun Pharma’s ₹12.1. An increased EPS represents greater value to shareholders and therefore Dr Reddy’s is ahead in the EPS performance.
5. Dividend
Dividends indicate the share of net-profit that is given to equity holders of the company. Dr Reddy’s announced a dividend yield of 12%, while Sun Pharma provided a dividend of 34%.
6. P.E. Ratio
PE refers to price to earnings, which means in the comparison to price how much earning the company is doing. A lower PE is usually better as it indicates undervalued and more potential.
Dr Reddy’s Labs’ PE ratio is 18.1x, and Sun Pharmaceuticals’ PE ratio is 37.3x and the industry PE of this sector is 29x. Based on the PE ratio, Dr. Reddy’s appears more attractively valued, while Sun Pharma commands a premium, possibly due to its size or anticipated growth.
7. Return on Equity
RoE is return on equity, which shows how much returns the company is getting in comparison to the equity of the company. Higher the RoE, the better. Dr. Reddy’s RoE stands at 21.4%, while Sun Pharma’s is 16.7%. This indicates that Dr. Reddy has made more effective use of its capital, generating higher returns on overall equity.
8. New Product Launch
New product launches are important as they enable companies to expand their business, and understand the medical needs. Dr. Reddy’s launched 2 significant products in India whereas Sun Pharma leads here as it launched 12 new products in India and 4 new generic products in the U.S.
9. R&D Spending
Research and development (R&D) is essential for creating new therapies, addressing unmet medical needs, and ensuring long-term growth in the evolving healthcare landscape. Dr. Reddy’s allocated ₹666 crores to R&D in Q3 FY25, which is 8% of its sales. Meanwhile, Sun Pharma spent ₹8,450 million on R&D in the same quarter, or 6.3% of its sales, with 41% of the budget directed towards specialty R&D.
10. Debt to Equity Ratio
The debt-to-equity ratio shows how much debt the company has in comparison to its equity. The lower this ratio, the better, as it shows less debt. Furthermore, both the companies’ debt-to-equity ratios are almost low, with Dr Reddy’s at 0.16 and Sun Pharma at 0.01, almost nil. While both companies are financially healthy in this regard, Sun Pharma has a slight edge due to its minimal reliance on debt.
Based on the above comparison of the companies on the metrics, some observations can be drawn:
| Metric | Dr Reddy’s Laboratories Ltd | Sun Pharmaceutical Industries Ltd |
| Revenue | 👎 | 👍 |
| EBITDA | 👎 | 👍 |
| Net Profit | 👎 | 👍 |
| EPS | 👍 | 👎 |
| Dividend | 👎 | 👍 |
| Stock Returns | 👎 | 👍 |
| P.E. | 👍 | 👎 |
| ROE | 👍 | 👎 |
| New Product Launch | 👎 | 👍 |
| R&D | 👎 | 👍 |
| Debt to Equity | 👎 | 👍 |
Also Read: Secrets of Successful Intraday Trading: Tools and Techniques for Beginners
Share market performance
Dr Reddy’s Laboratories is currently trading at a price of ₹1,176 as of 29 April 2025. Further, the stock has made a 52-week high and low of ₹1,421 and ₹1,020 respectively.
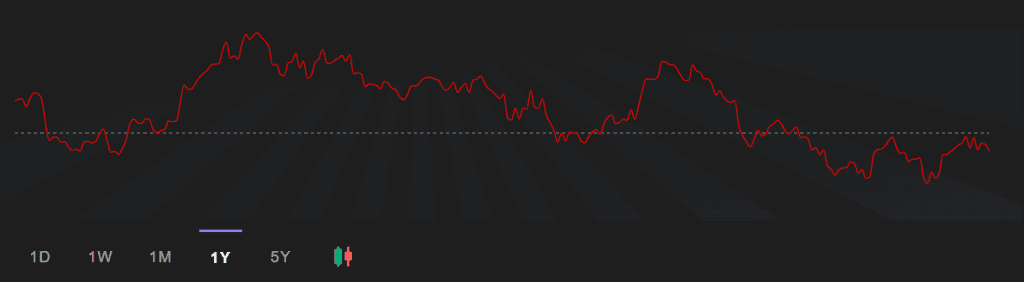
Source: StockGro
Sun Pharmaceuticals Industries Ltd is currently trading at a price of ₹1,805 as of 29 April 2025. Further, the stock has made a 52-week high and low of ₹1,960 and ₹1,377 respectively.
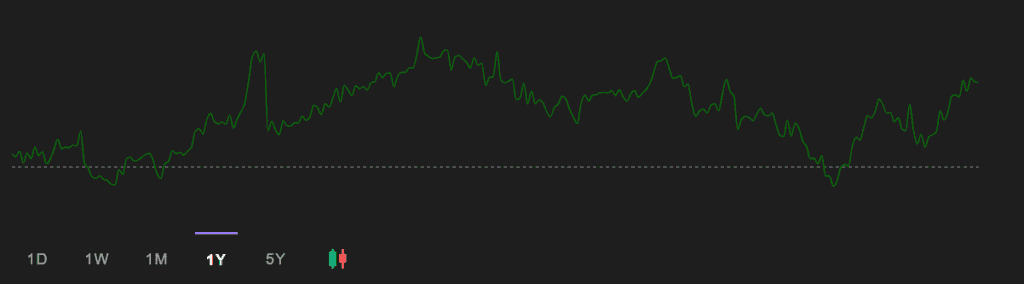
Source: StockGro
| Returns | Dr Reddy’s Laboratories Ltd | Sun Pharmaceutical Industries Ltd |
| 1 Month | -2.06% | -0.46% |
| 6 Months | -9.79% | -3.92% |
| 1 Year | -6.05% | 18.64% |
| 5 Years | 47.58% | 264.85% |
Sun Pharma has outperformed Dr Reddy’s in terms of returns. As seen in the image above, Sun Pharma has shown greater resilience, even during recent market downturns. In the past 1 and 6 months, Sun Pharma’s decline was minimal at 0.46% and 3.92%, respectively, while Dr Reddy’s saw more significant corrections, with declines of 2.06% and 9.79% during the same periods.
Looking at the 1 year, Dr Reddy’s experienced negative returns of 6.05%, while Sun Pharma achieved a strong positive return of 18.64%. The gap widens further when considering 5 years, with Sun Pharma delivering a return of 264.85%, compared to Dr Reddy’s 47.58%.
Dr Reddy vs Sun Pharma– Which one looks stronger?
When comparing key metrics, Sun Pharmaceuticals leads in revenue generation, dividend payouts, new products, R&D, debt to equity, stock performance. However, Dr Reddy’s Laboratories outperforms critical financial indicators such as EBITDA margin, net profit margin, EPS, PE, ROE, etc
As dominant players in India’s pharmaceutical sector, both companies face intense competition. Investors should analyse these metrics comprehensively before allocating capital.