Summary
The hammer is a bullish reversal candlestick with a small body and long lower shadow.
It indicates potential price reversal after a downtrend.
Traders use it to plan entry points and confirm trend changes in technical analysis.
What is Hammer Candlestick Patterns?
There can be varied candlestick patterns in terms of formation, each with its own interpretation and implications for price direction. A recognised candlestick pattern is the hammer.
Others include doji, shooting star, engulfing, and hanging man. The pattern’s name – hammer – is based on its shape’s resemblance to a hammer.
It is a single candlestick pattern, indicating a potential bullish reversal in a price chart. In other words, it suggests a downward price swing that has encountered significant buying pressure, resulting in a potential shift in market sentiment and the likelihood of a bullish reversal.
Price action traders can identify reliable price reversal points by observing hammer chart patterns. Hammer patterns usually appear after a period of bearish trend or at the end of a correction.
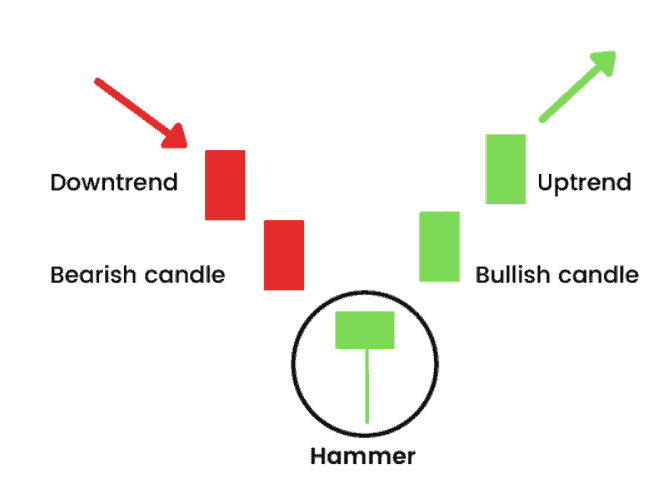
It is characterised by its distinct appearance, consisting of the following main components:
Position: A hammer pattern forms near the bottom of a trend.
Shape: This single candlestick pattern has a small body and a long lower shadow (i.e. shadow extends downward from the body), at least twice that of its body. Generally, the upper shadow does not exist. If present, it usually tends to be of minimal length.
Colour: Hammer’s body can be green (bullish) or red (bearish).
How Hammer Candlestick Works in Trading
The hammer candlestick works by visually representing a battle between sellers and buyers, where buyers eventually regain control after strong selling pressure.
- Market Psychology Shift:
During the formation of a hammer, sellers initially dominate and push prices lower. However, as the session progresses, buyers step in aggressively and push the price back up near the opening level. This shift signals that selling pressure is weakening. - Rejection of Lower Prices:
The long lower shadow indicates that the market tested lower levels but failed to sustain them. This rejection is critical because it shows that lower prices are not accepted by participants, increasing the probability of a reversal. - Institutional Buying Activity:
In many cases, hammer formations are driven by institutional investors accumulating positions at lower levels. This hidden buying strength often precedes a broader uptrend. - Confirmation Is Essential:
A hammer alone is not a guaranteed reversal signal. Traders typically wait for a confirmation candle, where the next session closes higher, validating bullish momentum. Without confirmation, the pattern may fail. - Combination with Indicators:
The reliability of a hammer increases when combined with tools like Relative Strength Index (RSI). If RSI shows oversold conditions (below 30) at the time of hammer formation, the probability of reversal becomes stronger. - Support Zone Alignment:
Hammer candlesticks near historical support levels carry higher significance. When price action aligns with key support, it strengthens the reversal probability further.
Types of Hammer Candlestick Patterns
- Standard Hammer: Appears in a downtrend with a small body at the top and a long lower shadow. Signals potential bullish reversal.
- Inverted Hammer: Found at the bottom of a downtrend, has a long upper shadow and small lower body. It requires confirmation from the next candle to validate reversal.
- Long-Legged Hammer: Has longer lower shadows, indicating stronger buying interest after deeper price testing.
How to Identify a Strong Hammer Candlestick
- Small Real Body: The smaller the body relative to the shadow, the stronger the reversal signal.
- Long Lower Shadow: Indicates rejection of lower prices; ideally at least twice the length of the body.
- Location in Downtrend: Occurring after a clear downtrend increases reliability.
- Confirmation Candle: Follow-up bullish candle confirms buyers’ strength and validates the reversal.
Strong hammers are usually accompanied by increased trading volume, suggesting significant market participation.
Hammer Candlestick Trading Strategies
- Buy After Confirmation: Enter long positions once the candle after the hammer closes bullish.
- Support-Based Entry: Combine hammer patterns with strong support levels for higher probability trades.
- Use Stop Loss: Place stop-loss orders just below the hammer’s low to limit potential losses.
- Combine with RSI: Relative Strength Index (RSI) can confirm oversold conditions for stronger entry signals.
Using multiple technical tools alongside hammer candlesticks enhances reliability and reduces false signals.
Real-World Example of Hammer Candlestick
Index Recovery After Sharp Selloff (Nifty 50 Case)
A hammer candlestick often appears after a strong downtrend, and one classic example can be seen in the Nifty 50 during a broad market correction. Suppose the index falls continuously for several sessions due to global uncertainty and profit booking, dropping from 22,400 to 21,700 levels.
On a particular day, the index opens lower and continues to fall sharply, hitting an intraday low near 21,500. However, strong buying interest emerges in the second half of the session, pushing the index back up to close near 21,800. This creates a hammer candlestick with a long lower shadow and a small body at the top, signaling rejection of lower prices.
The next trading session becomes important for confirmation. When the index opens higher and continues its upward move, it confirms that buyers have regained control. Traders who identified this hammer and waited for confirmation could enter long positions and benefit from the short-term recovery rally.
Stock-Specific Reversal (Reliance Industries Case)
A similar pattern can be observed in large-cap stocks like Reliance Industries during temporary corrections. Suppose the stock declines sharply after weak market sentiment and falls from ₹2,500 to ₹2,350 in a few sessions.
On a trading day, the stock opens weak and drops further to ₹2,300, but strong institutional buying pushes it back up to close near ₹2,380. This forms a hammer candlestick, indicating that sellers failed to sustain lower levels.
In the following session, the stock continues upward movement, confirming the bullish reversal. Traders using this hammer signal with proper stop-loss below the low of the candle could capture the short-term upside momentum.
Intraday Hammer Formation (Short-Term Trading)
Hammer candlesticks are not limited to daily charts; they also appear in intraday timeframes such as 15-minute or 1-hour charts. For example, a stock may fall sharply in the morning session due to negative news but recover quickly by noon.
If the price drops significantly but recovers by the end of the trading hour, forming a hammer-like structure, it signals intraday buying interest. Traders often use this setup to enter quick reversal trades with tight stop-loss levels.
Common Mistakes Traders Make with Hammer Candlestick
- Ignoring Trend Context: Entering trades without ensuring the hammer forms after a downtrend can lead to false signals.
- No Confirmation: Acting on a hammer without waiting for the next bullish candle increases the risk of reversals failing.
- Overreliance on RSI: Using relative strength index (RSI) alone without price pattern context can produce misleading entries.
- Ignoring Volume: Low-volume hammers are less reliable; ignoring this can result in entering weak setups.
Patience and confirmation are crucial to avoid these mistakes and improve trading outcomes.
Hammer Candlestick vs Other Candlestick Patterns
| Pattern | Formation | Signal | Key Difference |
| Hammer | Small body, long lower shadow | Bullish reversal | Appears after downtrend; requires confirmation |
| Hanging Man | Small body, long lower shadow | Bearish reversal | Appears after uptrend; signals potential reversal downward |
| Inverted Hammer | Small body, long upper shadow | Bullish reversal | Different shadow placement; requires follow-up confirmation |
In essence, the context (trend location) and confirmation are what distinguish the hammer from similar-looking patterns like hanging man or inverted hammer.
Conclusion
The hammer candlestick is a reliable tool for identifying bullish reversals after downtrends, especially when combined with trend analysis, support levels, volume, and RSI. Traders should focus on context, confirmation, and risk management to capitalize on these patterns effectively. Avoiding common mistakes, like premature entries or ignoring market context, enhances the probability of successful trades.
FAQs
Yes. The hammer is generally bullish when it forms after a downtrend, indicating potential reversal.
Yes. Reliability improves when confirmed by the next bullish candle, volume, and trend context.
A hammer has a long lower shadow with a small body at the top, while an inverted hammer has a long upper shadow; both require context and confirmation.
Yes. Beginners can use it effectively by combining it with support levels, volume analysis, and confirmation candles.
Indicators like RSI, moving averages, and MACD help confirm oversold conditions and validate reversal signals.
Yes. It can be used on intraday charts, but confirmation with volume and context is even more critical due to market noise.
Common mistakes include ignoring trend context, acting without confirmation, and neglecting volume or RSI signals.
Yes. Beginners can use virtual trading platforms to practice entries, stop-loss placements, and trade management without real money risk.