Commercial vehicles, such as trucks, are an essential part of the logistics sector. They transport raw materials, goods, and commodities from one place to another. India, a rapidly growing economy, needs more commercial vehicles than ever to support businesses.
In the month of April 2025, a total of 90,558 units of commercial vehicles were sold in India. Tata Motors was the leading player in terms of the number of vehicles sold, followed by Mahindra and Mahindra and Ashok Leyland.
Let us take a look at a detailed comparison of two key commercial vehicle manufacturers in India – Mahindra & Mahindra Vs Ashok Leyland.
Company overview
Here is a detailed overview of both companies.
Mahindra & Mahindra Limited.
Mahindra & Mahindra (M&M) has been around for 79 years. M&M is involved in the business of manufacturing passenger vehicles, farm equipment like tractors, three-wheelers, small pick-up trucks and commercial vehicles like buses and trucks.
In April 2025, the company sold
- 54,860 units – Passenger vehicles
- 22,989 units – Commercial vehicles
- 31,586 units – Farm equipment
The company also manufactures electric vehicles under its model names XEV 9e and BE 6. The manufacturer has a goal to become carbon neutral by 2040. The company employs more than 2,60,000 people as of April 2025.
In the last quarter (Jan – March) of FY25, Mahindra & Mahindra Limited earned standalone revenue of ₹31,609 crores and a standalone PAT (profit after tax) of ₹2,437 crores. In FY25, the company made a capital expenditure of ₹5,033 crores.
Also read: Tata vs Mahindra: Full comparison of top rivals
Ashok Leyland Limited
Ashok Leyland Limited is a company of the Hinduja Group. Hinduja Group also owns Gulf Oil Lubricants India Limited and IndusInd Bank Limited.
Ashok Leyland is involved in the manufacturing of trucks, buses, light commercial vehicles, and defence vehicles. Apart from that, the company manufactures marine engines and power generators. The company operates in more than 50 countries.
In April 2025, the company sold a total of 13,421 units of vehicles, among which were:
- 6,119 units – Medium and heavy commercial vehicles (Trucks)
- 1,841 units – Medium and heavy commercial vehicles (Buses)
- 5,641 units – Light commercial vehicles.
The company owns ten manufacturing units in five countries with a daily production capacity of 500 units.
In Q4FY25, the company earned a revenue of ₹11,906 crores and a net profit of ₹1,246 crores.
An interesting read: Secrets of Successful Intraday Trading: Tools and Techniques for Beginners
Mahindra & Mahindra and Ashok Leyland comparison
Here are the financial performance & key financial ratios of Ashok Leyland Limited and Mahindra & Mahindra Limited as of FY25.
| Particulars (₹ crores) | M&M (FY25) | Ashok Leyland (FY25) |
| Market Capitalisation (as on 23rd May 2025) | 3,74,426 | 70,375 |
| Sales | 1,59,221 | 48,535 |
| Operating Profit | 30,518 | 9,208 |
| Net Profit | 14,073 | 3,383 |
| Net Profit Margin % | 8.83% | 6.97% |
| Earnings per share | 103.97 | 10.58 |
| Particulars (on 23rd May 2025) | M&M | Ashok Leyland |
| ROE% | 18% | 29.2% |
| ROCE% | 14.1% | 14.4% |
| Price to Earnings Ratio | 29 | 22.7 |
| Price to Book Value | 4.85 | 5.76 |
| Debt to Equity | 1.62 | 4.08 |
| Interest Coverage Ratio | 3.10 | 2.17 |
| Inventory Turnover Ratio | 4.92 | 7.43 |
- Sales: Mahindra & Mahindra has higher sales than Ashok Leyland. This is because, unlike Ashok Leyland, M&M earns a major portion of its revenue from passenger vehicles. Ashok Leyland only manufactures commercial vehicles.
In terms of commercial vehicles alone, M&M sold 22,989 commercial vehicles in April 2025, whereas Ashok Leyland sold 13,421 units, showing larger operations of M&M.
- Net profit and net profit margin: M&M have a higher net profit than Ashok Leyland as a result of its higher sales numbers.
On top of that, M&M even has a higher PAT margin at 8.83%, indicating that it converts its revenues into net profit more efficiently than Ashok Leyland (NPM – 6.97%).
- Market capitalisation and valuation: With higher sales and higher net profit, M&M has a bigger market capitalisation than Ashok Leyland.
In terms of price-to-earnings ratio, M&M has a higher P/E ratio of 29 as compared to 22.7 of Ashok Leyland (industry P/E is 22.71). At the same time, Ashok Leyland has a higher price-to-book ratio than M&M.
Ashok Leyland’s higher price-to-book ratio despite a lower P/E suggests investors value its assets more aggressively, which might be due to its higher ROE% (at 29%) than M&M (at 18%), showing better asset efficiency.
- Debt ratios: Ashok Leyland has a higher debt-to-equity ratio (at 4.08) as compared to M&M (at 1.62). At the same time, it has a lower interest coverage ratio than M&M.
This shows a higher debt and interest payment burden on Ashok Leyland as compared to M&M.
- Inventory turnover ratio: Ashok Leyland has a higher inventory turnover than Mahindra. This shows that Ashok Leyland replaces its inventory more frequently.
This could be due to a focused product line of Ashok Leyland, as compared to a diversified product mix of Mahindra & Mahindra.
Check this out: Adani Green vs Tata Power: Who leads the charge in India’s evolving power sector?
Mahindra & Mahindra Vs Ashok Leyland stock performance
As of 26th May 2025, Mahindra & Mahindra stock is trading at ₹2994.17. The stock has made a 52-week high of ₹3,475 and a 52-week low of ₹2,413.
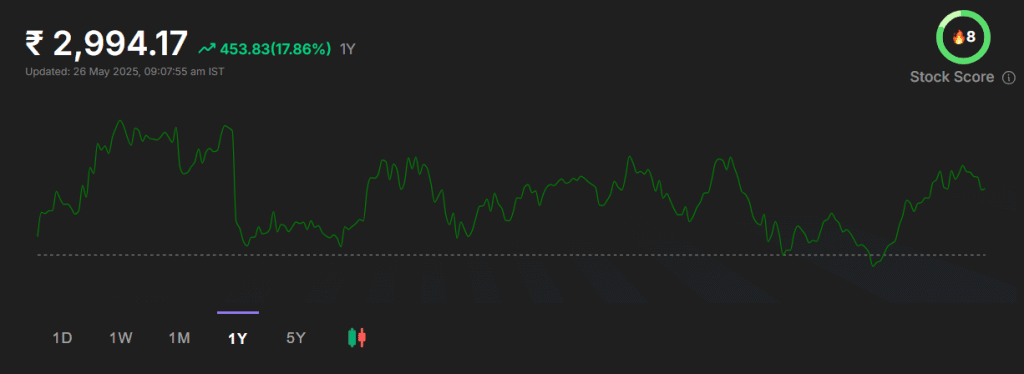
The stock has gained 17.86% in the past one year and 265% in the past 5-years (as of 26th May 2025).
Ashok Leyland limited stock, as of 26th May 2025, is trading at ₹235.79. The stock has made a 52-week high of ₹280.43 and a 52-week low of ₹189.72.
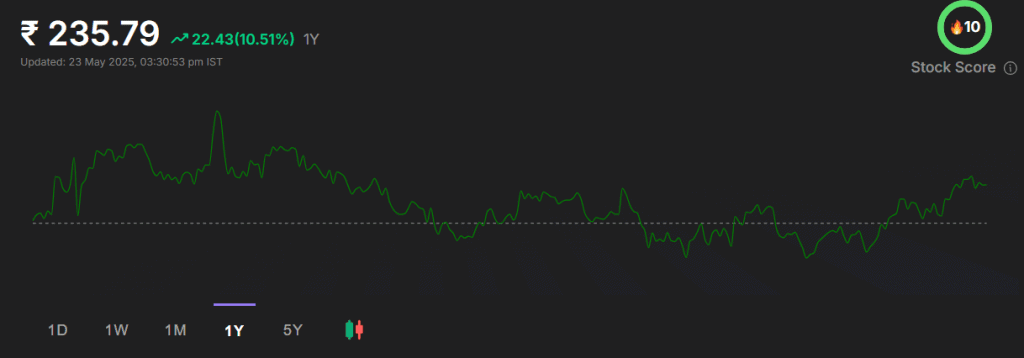
The stock has gained 10.51% in the past one year and has gained 87% in the last 5-years (as of 26th May 2025).
Conclusion
Mahindra & Mahindra and Ashok Leyland are two strong players in India’s commercial vehicle space, but their business models differ significantly. While M&M focus on a diversified range of products, Ashok Leyland focuses on commercial vehicles. While making the Mahindra and Ashok Leyland comparison, M&M leads in terms of revenue, profit, and market capitalisation. However, Ashok Leyland showcases stronger return ratios like ROE and better asset utilisation. Investors should conduct their own research and consider various factors before making any investment decisions.