
A country’s economy relies completely on its financial health. The stock market as we all know, plays a powerful role in the country’s finances. Hence, analysing the performance of the country’s stock market and its contribution to the whole economy is crucial.
The market capitalisation to GDP ratio is an indicator that aids in this analysis. In this article, we will walk through what this ratio is and what it tells us about the economy.
What is market capitalisation?
Market capitalisation refers to the total value of a company’s stocks accessible for public trading on the stock exchange. Market capitalisation is a widely used method to determine a company’s size.
During an IPO, a company establishes its market capitalisation, which then changes based on the market price of shares in the secondary market.
Market capitalisation = Number of shares outstanding * Current market price per share.
What is GDP?
GDP stands for Gross Domestic Product.
GDP indicates the total monetary worth of all products and services made in a country during a specific time period. It considers the value of finished goods alone to avoid double counting. It is one of the basic measures of a country’s economic position.
What is the market capitalisation to GDP ratio?
The market capitalisation to GDP ratio is a mathematical indicator that suggests the total contribution of a country’s stock market to the overall economy.
It indicates whether the market is overvalued or undervalued. While a low ratio may suggest an undervalued market, a high ratio suggests an overvalued market. A ratio that is close to 100 may indicate a fairly valued market.
Market cap to GDP ratio = Total market capitalisation of the stock market / GDP of the country
Significance of the Buffett indicator
The market cap to GDP ratio is also famous as the Buffett indicator since Warren Buffett once credited this as one of the best valuation indicators available.
The ratio helps analyse how publicly listed companies are performing in the country. It also works as a comparative indicator in analysing the performance of companies over the years.
While market capitalisation considers the performance of listed companies alone, the GDP accounts for the performance of primary, secondary and tertiary sectors together.
Hence, underdeveloped economies that largely run on the primary sector’s income have a low GDP-to-market cap ratio, while developed countries with large corporations have a higher GDP-to-market cap ratio.
The Buffet indicator is effective in formulating economic policies and developing ideas to support the growth of public companies in the country. Though the primary sector is essential for the survival of an economy, the development of public enterprises is significant to the country’s economic growth.
Example
Consider a hypothetical country with a total market capitalisation of ₹10 crores and a GDP of ₹40 crores.
So the market cap to GDP ratio = 10 crore / 40 crore = 25%
It indicates that the market is undervalued since the percentage is low. It is also possible that the country is underdeveloped and does not have significant contributions from public corporations.
The market capitalisation to GDP ratio in India can be calculated on the basis of market capitalisation details published by the BSE (Bombay Stock Exchange) and the GDP data issued by the MoSPI (Ministry of Statistics and Programme Implementation).
As per Guru Focus, a stock market research firm, the current market capitalisation to GDP ratio of India as of 18 Oct 2023 is 96.8%, indicating that the Indian market is fairly valued.
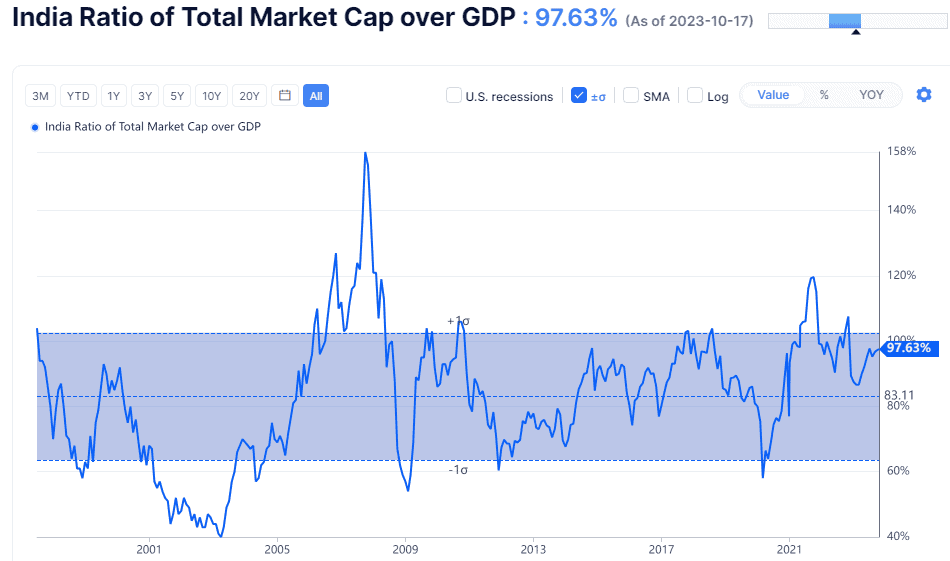
Source: Guru Focus
Criticisms of the indicator
Though the Buffett indicator was widely praised at the time of its introduction, it is not as relevant in today’s times due to the changing economy.
- Private equity investments are growing today. Their contribution to the country’s economy is noteworthy. However, it is not part of the Buffett indicator as the shares are not listed on stock exchanges.
- The indicator considers only the market capitalisation of companies and not their actual revenues and profits that contribute to the GDP. Hence, this ratio can be misleading at times.
- The indicator assumes that the country’s economic performance is directly related to the capacity of its stock markets. This need not be true as other sectors may be contributing better to the economy. While public companies are essential for growth, it is wrong to say that they are the only ones impacting the country’s progress.
- The ratio considers stock markets in particular and not financial markets in general. Hence, it excludes the performance of other financial instruments like bonds, commodities, etc.
- There is no standard that determines the ideal ratio to ascertain whether a market is overvalued or undervalued. While some people consider 100% as a fairly valued market, others see it as an overvalued market. Without clarity on this aspect, it is complex to formulate policies for the development of public companies and the whole economy.
Stock Market GDP Contribution Percentage
The stock market does not directly contribute to Gross Domestic Product (GDP) in the same way industries like manufacturing, services, or agriculture do. However, it plays a major indirect role in economic growth by helping companies raise capital, expand businesses, and create jobs.
GDP measures the total value of goods and services produced in an economy, while the stock market represents the market value of publicly listed companies. Even though stock market activity itself is not counted as production, it significantly supports economic development.
One way economists understand the relationship between the stock market and the economy is through the market capitalisation-to-GDP ratio, often called the Buffett Indicator. This ratio compares the total value of all listed companies in a country to its GDP.
For example:
- In India, the stock market capitalisation has often ranged between 90% and 110% of GDP depending on market conditions.
- In the United States, the ratio has frequently exceeded 150% to 200%, reflecting the large presence of technology and multinational companies.
- In developing markets, this ratio may be lower because fewer companies are listed and capital markets are still growing.
A higher ratio generally indicates a more developed financial market where businesses rely on equity markets to raise funds. Strong capital markets also attract foreign investment, encourage innovation, and improve capital allocation across industries.
Therefore, while the stock market does not directly add to GDP calculations, it acts as a critical engine for economic growth by financing businesses and supporting long-term development.
Difference Between Market Cap And GDP
| Basis of Comparison | Market Capitalisation (Market Cap) | Gross Domestic Product (GDP) |
|---|---|---|
| Definition | Market cap refers to the total value of a company’s outstanding shares in the stock market. | GDP refers to the total monetary value of all goods and services produced within a country during a specific period. |
| What It Measures | Measures the market value of publicly listed companies based on investor expectations. | Measures the economic output of an entire country. |
| Calculation | Market Cap = Share Price × Total Outstanding Shares. | GDP is calculated using production, income, or expenditure methods across the economy. |
| Scope | Includes only publicly traded companies listed on stock exchanges. | Includes all economic activities, including private businesses, government spending, and services. |
| Nature | Reflects investor sentiment and expectations about future growth. | Reflects actual economic production and performance. |
| Volatility | Highly volatile, changes daily with stock price movements. | Relatively stable, usually measured quarterly or annually. |
| Coverage | Represents the corporate sector of the stock market. | Represents the entire national economy. |
| Time Perspective | Shows the current market value at a given point in time. | Measures economic activity over a specific time period, typically a year. |
| Example | If a company has 1 crore shares priced at ₹500, its market cap is ₹500 crore. | If a country produces goods and services worth ₹300 lakh crore in a year, that amount represents its GDP. |
Bottomline
The market capitalisation to GDP ratio also called the Buffet indicator, helps ascertain the contribution of public corporations to the country’s economy.
However, this ratio is not considered ideal as it is inefficient in providing a comprehensive view of the economy. Hence, the Buffett indicator doesn’t allow an apple-to-apple comparison as the GDP, unlike market capitalisation, considers all the economic sectors.
FAQ’s
The Market Cap to GDP ratio compares a country’s stock market value to its economic output (GDP). It helps assess if the market is overvalued or undervalued relative to the economy.
GDP growth often leads to higher corporate profits, boosting stock prices. However, rapid growth can lead to inflation and interest rate hikes, which may negatively impact stocks.
The ratio of market cap to GDP shows how the stock market compares to the overall economy. A high ratio may suggest overvaluation, while a low ratio indicates potential undervaluation.
A good ratio is typically between 50% and 75%. Above 100% may indicate overvaluation, while below 50% could signal undervaluation.
The stock market can grow faster than GDP through higher corporate profits, foreign investment, technological innovations, and stock buybacks.
Comparing market cap with GDP is misleading because they measure different things. Market cap reflects investor expectations about a company’s future growth, while GDP measures the total value of goods and services produced in a country in a year. Also, large companies operate globally, so their valuation represents worldwide business, not just one country’s economy.
Differences in market capitalisation can show how developed a country’s financial markets are. Economies with higher market cap often have stronger capital markets, more listed companies, and greater investor participation. Rising market cap in a country may also indicate economic growth, innovation, and increasing global investment interest.