In the trading world, it is crucial to understand the movement of volume and price. One tool that traders often use to analyse these movements is the on-balance volume (OBV) indicator.
Developed by Joseph Granville in the 1960s, the OBV indicator is a valuable tool that analyses price movements and volume data, helping traders make more informed decisions.
Let’s understand what this indicator is, how it is calculated, what the interpretation is, and more!
What is On-Balance Volume (OBV)?
The on-balance volume (OBV) indicator is a momentum-based tool that leverages the volume level to provide insights into the strength of a trend and potential trend reversals.
It measures the buying and selling pressure, accumulating volume when prices rise and deducting it when they fall.
Primarily used in trading stocks, indices, commodities, and Forex, the OBV is a pure momentum oscillator, much like the Relative Strength Index (RSI).
The on-balance volume indicator is based on a simple premise: when an asset closes higher than its previous close, all the volume for that day is considered as buying volume. Conversely, when an asset closes lower than the previous close, the volume is classified as selling volume.
The OBV line is a cumulative total of these buying and selling volumes. The line starts at zero and increases when the buying volume exceeds the selling volume, and it decreases when the selling volume surpasses the buying volume.
On-Balance Volume (OBV) Formula
The On-Balance Volume (OBV) formula adjusts a cumulative total based on whether the price closes higher or lower than the previous session.
- If today’s close > previous close
OBV = Previous OBV + Today’s Volume - If today’s close < previous close
OBV = Previous OBV − Today’s Volume - If today’s close = previous close
OBV = Previous OBV
How to Calculate On-Balance Volume?
Let us consider a simple example.
Assume a stock begins with an OBV value of 0.
| Day | Closing Price (₹) | Volume | Price Movement | OBV Calculation | OBV Value |
| Day 1 | 100 | 10,000 | – | – | 0 |
| Day 2 | 105 | 12,000 | UP | 0 + 12,000 | 12,000 |
| Day 3 | 102 | 8,000 | DOWN | 12,000 − 8,000 | 4,000 |
| Day 4 | 108 | 15,000 | UP | 4,000 + 15,000 | 19,000 |
In this illustration, OBV rises when the price advances and declines when the price falls. Over time, the indicator forms a trend line that reflects cumulative buying and selling pressure.
Using OBV in the Commodity Markets
Commodity markets respond quickly to shifts in supply, demand, and speculation. In such conditions, price alone may not fully reflect the strength behind a move. Within the framework of technical analysis, the OBV indicator assists traders by examining whether volume confirms or contradicts price behaviour.
- Confirming trends: A rising commodity price accompanied by rising OBV indicates sustained buying pressure and validates an uptrend. Similarly, falling prices with declining OBV confirm that selling pressure supports the downtrend.
- Spotting reversals (Divergence): When the commodity prices continue to rise, but OBV begins to fall, the divergence suggests weakening volume support. This negative divergence usually precedes a downward reversal, while a reverse scenario may signal a potential upward shift.
- Identifying accumulation or distribution: If the prices decline while the OBV remains stable or rises, it may indicate hidden accumulation. Such behaviour suggests that informed participants are building positions despite short-term weakness.
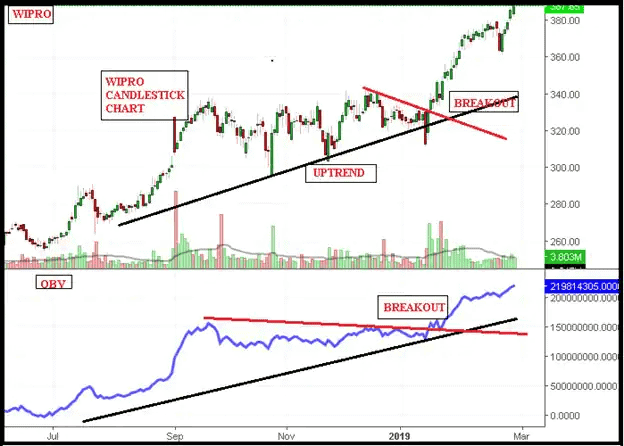
- Volume precedes price: The OBV operates on the principle that volume tends to lead price movement. A breakout in the OBV above its own resistance level can anticipate a similar breakout in the price, particularly in actively traded commodity contracts.
How Do You Interpret OBV?
The interpretation of OBV depends on how it moves in relation to price. The indicator is analysed for confirmation, divergence, accumulation, and breakout signals.
- Trend confirmation: When the price and the OBV rise together, the uptrend is supported by strong buying pressure. When both decline together, the downtrend is confirmed by sustained selling activity.
- Bearish divergence: When the price records a higher high but the OBV forms a lower high, the buying pressure is weakening, and a reversal may follow.
- Bullish divergence: When the price records a lower low but OBV forms a higher low, selling pressure is diminishing, and an upward reversal may develop.
- Accumulation: When the price moves sideways while the OBV rises, it indicates that positions are being accumulated before a potential breakout.
- Distribution: When the price remains range-bound while the OBV declines, it suggests that selling pressure is building ahead of a possible decline.
- Breakouts: When the OBV breaks above resistance or below support before the price does, it often signals that the price may soon follow in the same direction.
How Do You Use OBV for Trend Confirmation?
The use of OBV in trend confirmation is direct and methodical. The analyst compares the direction of price with the direction of the OBV line.
- If the price and OBV both are rising, the uptrend is strong, and buying pressure supports the move.
- If the price and OBV both are falling, the downtrend is strong, and selling pressure supports the decline.
- If the price rises but OBV stays flat or falls, the trend is weak, and the move lacks volume support.
- If the price falls but OBV does not decline, selling pressure is limited, and the downtrend may not sustain.
OBV vs Accumulation/Distribution Indicator
The following table outlines the difference between OBV and the Accumulation/Distribution indicator:
| Aspects | On-Balance Volume (OBV) | Accumulation/Distribution (A/D) |
| Principle | Volume is added or subtracted based solely on the direction of the closing price. | Volume is adjusted according to where the closing price lies within the day’s high–low range. |
| Calculation | Cumulative total of volume added on up days and subtracted on down days. | Cumulative total of volume multiplied by a price position factor known as the Money Flow Multiplier. |
| Sensitivity | Simpler and more responsive to price direction. | More refined, as it considers intraday price position. |
| Focus | Measures overall buying and selling pressure. | Measures the degree of accumulation or distribution within each session. |
| Interpretation | Used mainly for trend confirmation and divergence analysis. | Used to assess strength of accumulation or distribution during price movement. |
Challenges and Limitations of Using On-Balance Volume
The OBV indicator is a confirming tool, not a predictive instrument. Therefore, its interpretation requires caution and supporting analysis.
- Limited price consideration: The OBV takes into account only whether the closing price is higher or lower than the previous close. It does not consider the intraday high–low range or the strength of the close within that range.
- Distortion from volume spikes: A single session of unusually high volume can significantly alter the cumulative OBV line and may affect interpretation for several subsequent periods.
- Absence of defined threshold levels: The OBV does not provide overbought or oversold levels. It therefore cannot independently signal precise entry or exit points.
- Delayed divergence signals: The price and OBV divergence may continue for an extended period before a reversal occurs. The early divergence does not guarantee an immediate trend change.
Bottomline
In conclusion, the on-balance volume (OBV) indicator is a powerful tool in a trader’s arsenal. Analysing volume flow helps traders predict potential price movements and confirm trends.
However, it is essential to remember that, like all trading indicators, the OBV should not be used as a standalone tool. It is most effective when used with other indicators and analysis methods.
FAQ‘s
The OBV indicator is used to confirm trends and identify divergence between price and volume. The traders compare the OBV line with the price movement to determine whether buying or selling pressure supports the prevailing trend. It is commonly applied alongside support and resistance analysis to validate breakouts and potential reversals.
OBV is considered a reliable confirming indicator because it measures volume flow behind the price movements. It works well in trending markets and helps detect early signs of divergence. However, it is not a standalone trading system and should be combined with other technical tools for balanced decision-making.
A high OBV indicates sustained accumulation over time, meaning buying volume has exceeded selling volume. It reflects strong participation supporting price movement. However, the absolute value is less important than the trend. A rising OBV suggests strengthening demand, while a declining OBV signals increasing distribution pressure.