
Summary
RSI (Relative Strength Index) helps identify overbought or oversold conditions in intraday trading.
Adjusting RSI settings (e.g., 9- or 14-period) optimizes responsiveness for short-term trades.
Traders use RSI to time entry and exit points effectively.
Best RSI Settings For Intraday Trading
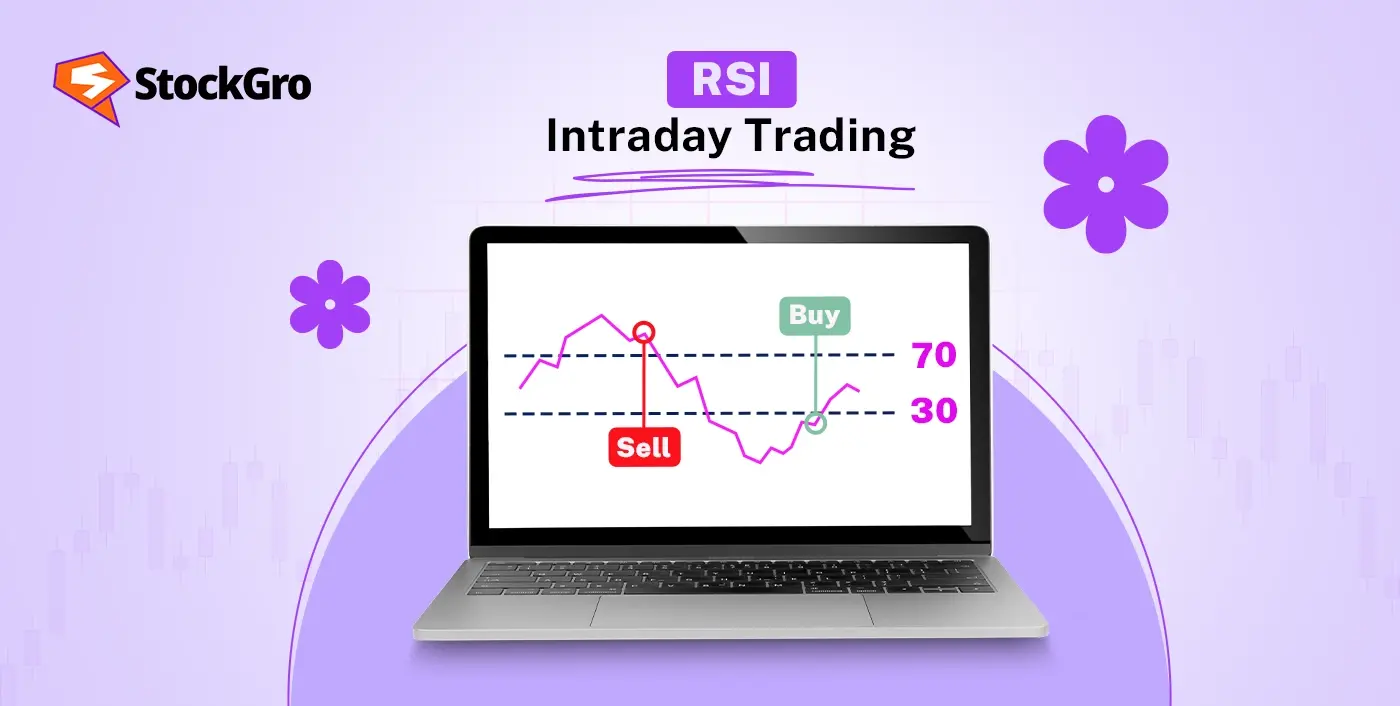
RSI short for relative strength index measures how fast and how far a stock’s price has moved recently, on a scale from 0 to 100. Above 70 and the stock is considered overbought it’s run up quickly and might be due for a breather. Below 30 and it’s oversold sellers may have pushed it too far down. That’s the textbook version. In real intraday trading, those levels and the period setting need adjusting.
The default 14-period RSI was designed for daily charts. On a 5-minute intraday chart, 14 periods covers barely over an hour of price action which sounds fast but actually makes RSI quite sluggish for catching quick intraday moves. Most experienced day traders drop the period to somewhere between 7 and 10. An RSI set to 7 reacts noticeably faster, hitting overbought and oversold zones more often and giving you earlier entries. The trade-off is more whipsaws signals that look good for thirty seconds and then reverse. An RSI of 9 or 10 sits in a nice middle ground for most people. Responsive enough to catch moves before they’re over, stable enough that you’re not chasing every wiggle.
Ideal RSI Settings for Different Intraday Trading Styles
Different speeds of trading need different RSI settings there’s no single number that works for everyone. Here’s how it breaks down, and for the broader picture of which tools pair best with each style, what are the best indicators for intraday trading is worth a look.
| Trading Style | RSI Period | Overbought / Oversold Levels | Why This Works |
| Scalping (trades lasting seconds to minutes) | 5–7 | 80 / 20 | Ultra-responsive; catches micro-moves but needs tight stops and fast exits |
| Momentum trading (riding strong moves for 15–45 min) | 7–9 | 70 / 30 | Balances speed with reliability; signals fire early enough to ride the bulk of a move |
| Swing-style intraday (holding 1–3 hours) | 10–14 | 70 / 30 | Smoother, fewer signals, higher quality entries; suits patient traders on 15-min charts |
One thing the table doesn’t capture some traders also adjust the overbought/oversold thresholds alongside the period. A scalper using RSI 5 might shift to 80/20 instead of 70/30 because a faster RSI hits those extreme zones more frequently. If you keep the standard 70/30 on a 5-period RSI, you’ll be drowning in signals. Tightening the thresholds filters out the weaker ones and leaves you with entries that have a bit more juice behind them.
How to Use RSI Signals Effectively in Intraday Trading
The most reliable RSI signal in intraday isn’t the overbought/oversold reading itself it’s the divergence. Say Nifty makes a new high on the 5-minute chart but RSI makes a lower high at the same time. Price is climbing, but the momentum underneath is fading. That mismatch called bearish divergence is one of the strongest warnings that a reversal might be loading up. The opposite works too. Stock hits a new low, RSI prints a higher low that’s bullish divergence, and it often precedes a snap-back rally.
The simpler signal RSI dropping below 30 then climbing back above it works fine but needs backup. Don’t just buy because RSI crossed 30 from below. Check if the stock is near a support level. Check if volume is picking up on that bounce. And pay attention to the time of day. RSI signals during the first hour (9:15–10:15 AM) tend to be more reliable because that’s when genuine momentum exists. The midday lull roughly 12 PM to 1:30 PM produces loads of RSI crossovers that go absolutely nowhere because the market isn’t moving with any real conviction.
Best Timeframes and Indicators to Combine With RSI
The 5-minute chart is the workhorse for most intraday RSI traders. Fast enough to generate multiple setups per session, slow enough that you’re not reacting to pure noise. If you’re more of a patient trader someone who takes two or three trades a day rather than ten the 15-minute chart with RSI set to 10 gives you cleaner entries with fewer false signals. You sacrifice some speed but the signals that do appear tend to be worth acting on.
Pairing RSI with other indicators makes a real difference. VWAP (volume weighted average price) and RSI together is a combination that’s hard to beat for intraday. When RSI hits oversold territory and the stock is trading above VWAP, that’s a strong pullback buy setup the broader trend is still up (price above VWAP) and RSI is telling you the dip might be overdone. Add a moving average as a trend filter say a 20-period EMA on your 5-minute chart and you’ve got a three-layer confirmation system. RSI for timing, VWAP for trend, EMA for momentum direction. Not complicated. But it catches good trades and keeps you out of bad ones more often than RSI alone ever will.
Common Mistakes Traders Make While Using RSI
Treating overbought as an automatic sell signal: RSI above 70 doesn’t mean “sell now.” In a strong uptrend, RSI can stay above 70 for ages while the stock keeps climbing. Selling purely because RSI hit 70 during a Reliance rally that runs from ₹2,900 to ₹2,980 means you exit at ₹2,930 and watch the remaining ₹50 move happen without you.
Using the default 14-period without questioning it: This setting was built for daily charts, not 5-minute ones. On an intraday timeframe, RSI 14 is too slow to catch most moves before they’re halfway done. Drop it to 7–10 and test for at least a week before deciding whether it suits your style.
Ignoring what time of day it is: An RSI oversold signal at 9:30 AM carries far more weight than the same signal at 12:45 PM. Morning sessions have real volume and momentum behind them. Midday signals are often just random chop triggering the indicator without any follow-through.
Relying on RSI without any confirmation: RSI says oversold but the stock is in a free fall, VWAP is sloping down, and there’s no support level anywhere nearby. That’s not a buy that’s a trap. RSI tells you momentum has stretched in one direction. It doesn’t tell you the direction is about to change. Always pair it with at least one other input.
Constantly changing the RSI period: Switching from 7 to 9 to 14 to 5 across different days means you never build a feel for how any single setting actually behaves on your usual stocks. Pick one. Trade it for 50 sessions. Then evaluate. The learning happens through repetition, not through endless tweaking.
Real-World Examples of RSI Intraday Trading Strategies
Example 1 Oversold bounce on Tata Motors. You’re watching Tata Motors on a 5-minute chart with RSI set to 9. The stock drops from ₹735 to ₹718 in the first hour. RSI hits 24 firmly oversold. You notice ₹715 has been a support level on the daily chart. The stock bounces off ₹718, RSI starts curling back up above 30, and volume ticks higher on the green candle. You buy at ₹720 with a stop at ₹714 (₹6 risk per share) and a target of ₹732 (₹12 reward). On 200 shares, that’s ₹1,200 risk for ₹2,400 potential gain a clean 1:2 setup. The stock hits ₹731 by 11:30 AM. You book profits and move on.
Example 2 Bearish divergence on Infosys. Infosys rallies from ₹1,540 to ₹1,568 on the 5-minute chart. Price makes a new high at ₹1,568. But RSI, which peaked at 74 during the first push, only reaches 68 this time. Lower RSI high while price makes a higher high classic bearish divergence. You wait for confirmation: the next candle closes red. You short at ₹1,564 with a stop at ₹1,572 (₹8 risk) and target ₹1,548 (₹16 reward). On 150 shares, you’re risking ₹1,200 for a potential ₹2,400. The divergence plays out and the stock fades to ₹1,550 by early afternoon. That RSI divergence read not the absolute number is what made the trade.
Final Recommendation
Drop the default 14. Start with RSI 9 on a 5-minute chart it’s the setting that works for the widest range of intraday styles without being too twitchy or too slow. Pair it with VWAP or a simple moving average for confirmation. Pay attention to divergences, not just overbought/oversold labels. And give your chosen setting at least a month of consistent use before deciding it doesn’t work. The best RSI traders aren’t the ones who found some secret period nobody else uses. They’re the ones who stuck with a sensible setting long enough to genuinely understand what it’s telling them and more importantly, when it’s telling them nothing at all.
FAQs
No. RSI 14 was designed for daily charts and reacts too slowly on intraday timeframes. Most day traders use RSI 7–10 for better responsiveness on 5-minute and 15-minute charts.
No, not reliably. RSI can stay overbought or oversold for extended periods during strong trends, generating misleading signals. Pairing it with VWAP, a moving average, or support/resistance levels significantly improves accuracy.
The 5-minute chart works best for most intraday traders. It generates enough signals to stay active while filtering out the tick-level noise that makes 1-minute charts unreliable with RSI.
Use a paper-trading account most Indian brokers like Zerodha and Groww offer virtual trading that mirrors live market conditions. Set up RSI on a 5-minute chart and practise spotting signals for at least a month before using real money.