
Automobiles have become a necessity in modern life, as people prefer using them to reach their destinations promptly and efficiently. Car manufacturers also recognise the evolving preferences of young consumers and produce vehicles that cater to their needs while remaining affordable.
Let’s take a look at the automobile industry in India, and a comparison between Tata Motors vs Mahindra & Mahindra.
Automobile industry in India
Rising Gross Domestic Product (GDP), increasing incomes, and the adoption of a more convenient lifestyle have led to an increased sales of automobiles, especially cars, in India. To serve the increasing demand from Indian consumers, car manufacturers are rolling out a record number of cars each year.
According to the Society of Indian Automobile Manufacturers passenger vehicle (four wheeler) sales in India reached 43,01,848 in FY25, increasing 2% from FY24. The electric car market also saw new registrations of 1 lakh units in FY25.
The Indian government policies are also supportive for car manufacturers. The Union budget introduced tax cuts for individuals, and it also removed basic import duty on materials required for making lithium ion batteries (used in EV cars).
An interesting read: Making Money in Stocks: A Beginner’s Guide to Investing
Company overview
Now let us take a look at the two major car manufacturers in India – Tata Motors and Mahindra & Mahindra.
Tata Motors Limited
Tata Motors is the flagship auto manufacturing company of the Tata group. The company owns 25 manufacturing units and 7 assembly units. It sells its cars in more than 125 countries.
Tata Motors also owns the luxury car maker Jaguar Land Rover (JLR). The company has also been a major player in the EV segment in India. Tata Motors also boasts a bold ambition of reaching net zero carbon emissions by 2045.
As of December quarter FY25, the passenger vehicle segment of Tata Motors earned a revenue of ₹12,354 crores, the commercial vehicle segment earned a revenue of ₹18,431 crores, and JLR earned a revenue of ₹81,264 crores.
Among the top 10 most-sold cars in India in March 2025:
- Tata Punch holds the third rank with 17,714 units sold
- Tata Nexon holds 7th rank with 16,366 cars sold.
Tata Motors conducted a meeting of its shareholders on 6th May 2025, for discussing the demerger of Tata commercial vehicles and passenger vehicles segment into two individual companies. The motion got approved with 99.9995% votes, and the demerger is expected to conclude by Q3FY26.
Also Read: Tata Motors Share Analysis
Mahindra & Mahindra Limited
Mahindra and Mahindra is the automobile manufacturing arm of the Mahindra Group. The company operates in more than 100 countries, and employs over 2,60,000 people as of March 2025. It is one of the key competitors of Tata Motors.
The company is involved in the business of manufacturing passenger vehicles, commercial vehicles, three-wheelers, tractors, and farm equipment. In the financial year 2025, the company sold 5,51,487 passenger vehicles, and exported 34,709 vehicles.
The top-selling Mahindra cars as of March 2025 are:
- Mahindra Scorpio – 13,913
- Mahindra Thar – 8.936
- Mahindra Bolero – 8,031
M&M has also made progress in the electric vehicle (EV) market, introducing models like the XEV 9e and BE 6. The company has an ambitious aim of reaching carbon neutrality by 2040.
On 27th March 2025, M&M announced the acquisition of a 58.96% stake in SML Isuzu for ₹555 crores.
Also Read: M&M stock analysis & expert insights in detail
Tata Motors vs Mahindra & Mahindra: Financial performance (FY24 and 9MFY25)
Here is the financial performance & key financial ratios of Tata Motors Limited, and Mahindra & Mahindra Limited as of FY24 and 9MFY25.
| Particulars (₹ crores) | M&M (FY24) | Tata Motors (FY24) | M&M (9MFY25) | Tata Motors (9MFY25) |
| Market Capitalisation (as on 28th April 2025) | 3,62,209 | 2,43,097 | 3,62,209 | 2,43,097 |
| Sales | 1,39,078 | 4,37,928 | 1,16,612 | 3,23,073 |
| Operating Profit | 24,892 | 59,538 | 22,607 | 40,987 |
| PAT | 12,270 | 31,807 | 10,531 | 22,311 |
| PAT Margin % | 8.82% | 7.26% | 9.03% | 6.90% |
| Earnings per share | 90.62 | 94.47 | 77.48 | 40.63 |
| Particulars (on 28th April 2025) | M&M | Tata Motors |
| ROE% | 18.4% | 49.4% |
| ROCE% | 13.6% | 20.1% |
| Price to Earnings Ratio | 29.2 | 7.62 |
| Price to Book Value | 5.14 | 2.41 |
| Debt to Equity | 1.66 | 1.05 |
| Interest Coverage Ratio | 3.13 | 4.93 |
| Inventory Turnover Ratio | 4.76 | 6.21 |
- Revenue: Tata Motors has higher revenue as compared to Mahindra and Mahindra. Tata Motors operates in many countries through its subsidiary JLR, which contributed 72.52% to the company’s total revenue in Q3FY25.
Tata Motors has a 3-year sales growth of 20.58%, M&M on the other hand has a 3-year sales growth of 23.25%, as of FY24.
- PAT & PAT Margin: Tata Motors earns a higher PAT as compared to M&M. In 9M FY25, M&M had a better PAT margin at 9.03% compared to 8.82% PAT margin of Tata Motors in the same period. It means M&M is more efficient in converting its revenues into net profits.
- Market Capitalisation & Valuation: Despite having higher sales, and PAT, Tata Motors have lower market capitalisation than M&M.
M&M has a P/E ratio of 29.2 and P/B ratio of 5.14 that is higher than the P/E (7.62) and P/B (2.41) of Tata Motors. The average automotive industry P/E ratio is 26.9 and P/B ratio is 10.69
M&M’s higher valuation could reflect possible investor optimism about its future growth prospects and leadership in electric SUVs.
- Return Ratios: Tata Motors has higher ROE% and ROCE% largely due to its lower valuations, especially a low book value relative to earnings.
Since ROE and ROCE measure returns on equity and capital employed, strong profits combined with a lower denominator significantly boosts these ratios.
- Debt Ratios: Debt to Equity and Interest coverage ratios indicate that Mahindra and Mahindra have higher debt burden, and interest payment burden as compared to Tata Motors.
Having lower debt burden can reduce costs and can help during economic slowdowns and periods of muted sales.
- Vehicles Sold: For the month of April 2025, Tata Motors sold 45,532 passenger vehicles, with total domestic sales (including commercial vehicles) being 72,753 units.
In the same month M&M sold 52,330 passenger vehicles, with total domestic sales (including commercial vehicles) being 84,170 units.
Tata Motors and Mahindra & Mahindra stock performance
As of 3rd May 2025, M&M limited is trading at the stock price of ₹2,906. The stock has made a 52-week high (highest price in the last 52 weeks from today) of ₹3,475 and a 52-week low of ₹2,355.
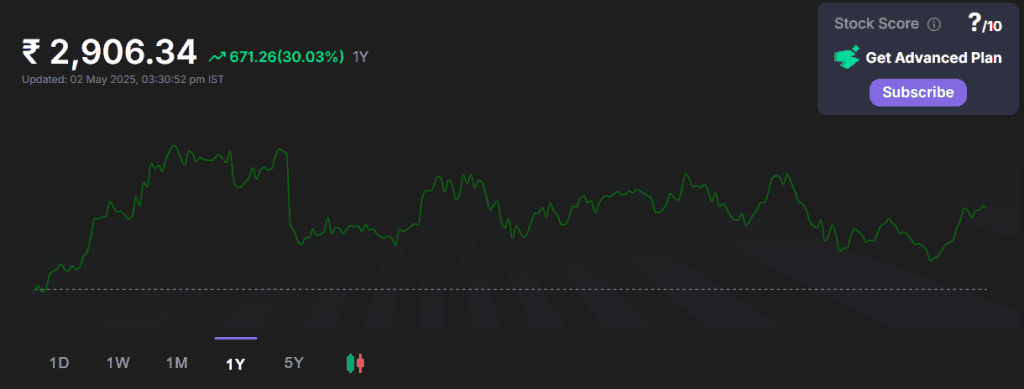
The stock has gained 30.03% in the last year. (as of 3rd May 2025).
Tata Motors Limited, as of 3rd May 2025, is trading at ₹644. The stock made a 52-week high of ₹1,337 and a 52-week low of ₹524.
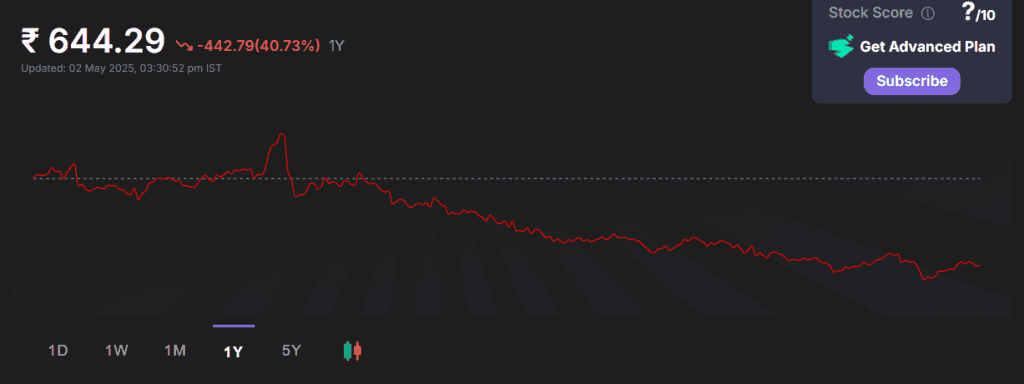
The stock has lost 40.73% in the past one year. (as of 3rd May 2025).
Conclusion
Tata Motors and Mahindra & Mahindra limited are both market leaders in the car manufacturing segment. Both companies offer cars suited to the needs of Indian customers. The presence of various car companies in the market promotes healthy competition and leads to new innovation. While comparing the automobile-making arms Tata vs Mahindra investors must conduct their own research and choose the best investment.