Trading stocks requires making a lot of thoughtful choices, particularly if you trade throughout the day. You must examine various technical charts and evaluate your investment decisions.
All of this is done to improve your chances of realising a profit and reduce market risk. Advanced candlestick patterns are used frequently in many automated trading algorithms that are used by professional traders.
This article includes a detailed discussion of the tweezer top candlestick pattern and the top-bottom candlestick pattern.
You’re looking at a candlestick chart, trying to decode its secrets like a stock market Sherlock Holmes. Now, here’s where it gets interesting – let’s talk about the “Tweezer Top”.
It’s like the market’s way of waving a little red flag, suggesting a potential shift in the winds. So, buckle up because we’re about to unravel this nifty candlestick pattern that could be your ticket to making shrewd trading decisions!
What is a tweezer top?
Tweezer candlestick patterns are a pair of candlestick trend reversal patterns. Tweezer tops indicate a bearish reversal, whereas tweezer bottoms indicate a bullish reversal. When two candlesticks’ highs after an uptrend are nearly identical, tweezer top candlestick patterns develop.
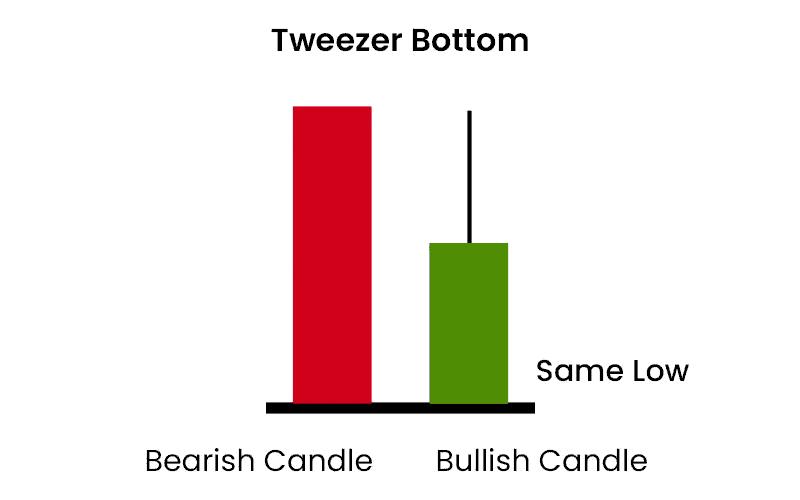
Tweezer bottom candlestick pattern occurs after a downtrend when the lows of two candlesticks are nearly or exactly the same.
It’s like a little warning sign. This happens when prices go up, and they try really hard to go higher but just can’t quite make it. It’s like they hit a ceiling. This pattern suggests that the market might be about to change direction, at least for a bit. So, it’s a heads-up for potential downturns!
Identification of tweezer top
Here are five simple steps to spot tweezer tops:
- Make sure it has been going up for a while. We’re looking for a trend that’s been on the rise.
- Now, check the chart for two candlesticks that have their tops at nearly the same level. It’s like they’re wearing matching hats!
- See those little lines above and below the candles. Those are called shadows. Make sure they’re about the same length on both candles.
- If the price tried to go higher but couldn’t, it’s a sign. Imagine it like hitting the ceiling – it just can’t go any higher.
- When you spot a tweezer top, it might mean the market’s about to shift gears. It’s like a signal that things could be turning around, at least for a little while.
Interpretation of tweezer top
There’s a point where the price doesn’t want to go higher – we call this a “resistance area.” When buyers hesitate to pay even more, it’s a sign of caution.
Then, sellers come in, and the price starts to drop. If you see several candles with the same highest point, it means that resistance is quite strong. This often hints that the upward trend might pause or even turn into a downward trend.
Typically, on the third day, you’ll see clear signs of the trend shifting, with candles showing more selling action.
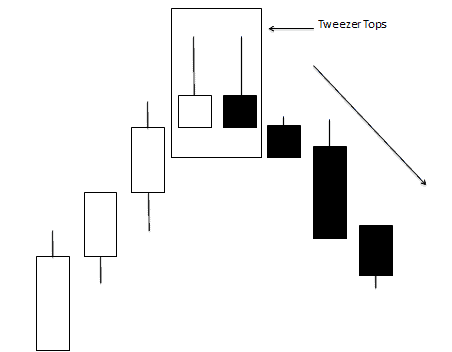
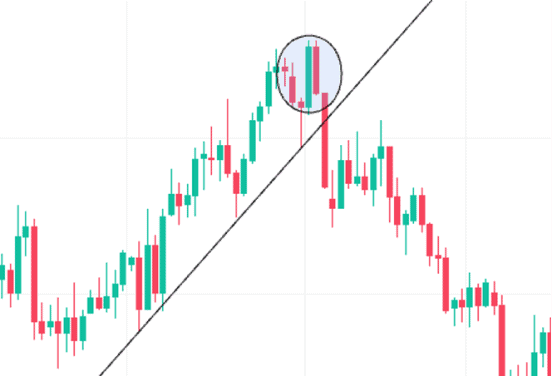
Tweezer top pattern
The tweezer top is a pattern in stock charts. The tweezer top candlestick pattern is a bearish reversal pattern with two candlesticks. It starts with a green candlestick, which appears on the first day of an uptrend in a stock.
This indicates that the price tried hard to go higher but couldn’t quite make it. The second day begins with a high, almost identical to the first. It’s a sign that the trend might be about to change.
Tweezer candlestick pattern– top and bottom
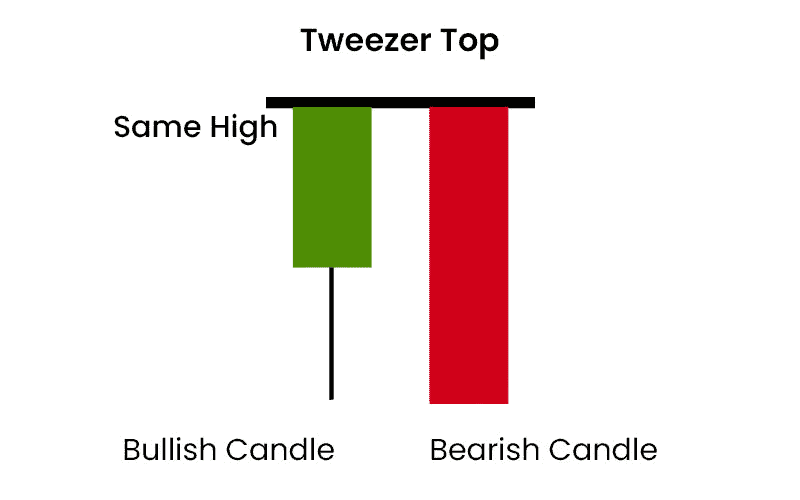
The tweezer top pattern is like a warning sign for investors. It shows up when there are two candles in a row. The first candle is like a cheerleader, it’s green which means the price went up.
Then comes a red candle, which means the price dropped. What’s interesting is that both of these candles have their highest point at the same level, or really close. It’s like a double-check that the price is stuck at a certain point.
The tweezer top is like a red flag in the stock market. It happens when two candles stand side by side, their tops at the same level. This means the price tried hard to go higher but just couldn’t. It’s like reaching a ceiling – there’s no going further up.
This pattern suggests the market might be about to change direction, at least for a bit. It’s a heads-up for potential downturns.
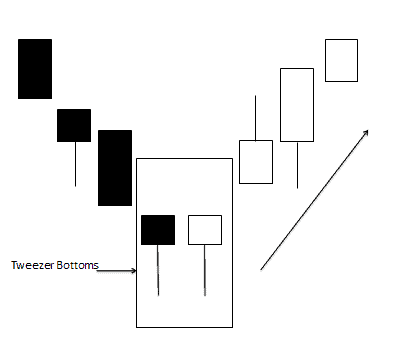
The tweezer bottom pattern is like a sign of hope for investors. It shows up when there are two candles in a row. The first candle is red, which means the price went down. It’s like saying, “Oh no, things are bad.” But then comes a green candle, which means the price went up.
Both of these candles have their lowest point at the same level, or really close. It’s like a signal that things might be turning around and getting better.
This one is like a green light. It shows up when two candles are standing together, their bottoms at the same level. This means the price tried hard to go lower but just couldn’t. It’s like hitting a floor – there’s no going further down.
This pattern suggests the market might be about to change direction, but this time, it could be an upward shift.
Difference between tweezer top and bottom
| Tweezer Tops | Tweezer Bottoms |
| Tweezer tops often happen after an uptrend, showing resistance to higher prices. | Tweezer bottoms usually occur after a downtrend, indicating support against lower prices. |
| Tweezer tops are considered bearish, suggesting a potential drop in prices. | Tweezer bottoms are seen as bullish, implying a potential rise in prices. |
| This suggests that the price tried hard but couldn’t go higher. | This indicates that the price struggled to go lower. |
How Tweezer Top Candlestick Formation
A tweezer top is a two-candle bearish reversal pattern that forms after an uptrend. It signals that the market has encountered strong resistance at a particular price level.
Formation Structure
- First Candle:
- Usually a strong bullish candle.
- Shows buyers are in control.
- Second Candle:
- Can be bullish or bearish.
- Has nearly the same high as the first candle.
- Fails to break above the previous high.
The key feature is that both candles have almost identical highs, indicating strong resistance. This shows buyers tried twice to push prices higher but failed, suggesting a potential reversal.
Confirmation
A bearish confirmation candle (closing lower) after the pattern strengthens the reversal signal. Volume increase during the second candle adds further credibility.
In simple terms, a tweezer top reflects exhaustion of buying momentum at a resistance level.
Bottomline
Tweezer top and bottom candlestick patterns can appear in a variety of ways, but they all share a few characteristics that appear at market turning points.
It’s important to note that while these patterns can signal a change in trend, it’s not a guarantee. Confirmation from other indicators or trends is crucial before making any big moves in the market.
FAQ’s
A double tweezer top refers to the same two-candle pattern where both candles form equal highs at resistance, reinforcing the bearish reversal signal.
A tweezer top is a two-candle bearish reversal pattern formed when two consecutive candles have nearly the same high after an uptrend.
Bullish tweezers, also called a tweezer bottom, form after a downtrend when two candles have nearly identical lows, signalling potential upward reversal.
A tweezer top is generally bearish. It indicates resistance and potential downward movement if confirmed by the next candle.