The IT sector is expected to contribute 10% of India’s GDP in FY26 up from 7.5% two years back in FY23. The Nifty IT Index, which peaked in October 2021, entered a consolidation phase between 34,000 and 37,000 that lasted until June 2024. Since then, the index has climbed to 46,000, reflecting renewed momentum and investor confidence in IT stocks.
With IT services continuing to grow, the trend is likely to carry on through 2025. Indian IT exports could reach USD 210 billion in FY25, making up about 18% of the worldwide IT outsourcing market. Among the prominent players in this sector are Wipro and HCL Technologies, both of which have played significant roles in shaping the industry. In this blog, let’s look at the financial performance of Wipro vs HCL Tech to understand how they compare.
Also Read: Mahindra vs Ashok Leyland: Who’s leading the commercial vehicle market?
IT sector overview
The IT sector is expected to double its revenue to USD 500 billion by 2030, gaining a global edge. With a score of 60 out of 100 in digital competitiveness, India ranks above all BRICS (Brazil, Russia, India, China, and South Africa) countries except China. It’s a clear sign of rising tech talent and the nation’s growing presence in the tech space.
Even the government is making efforts to grow this sector, as seen in the recent Union Budget 2025–2026. The ₹2000 crore allocation was made to AI promotion and infrastructure development. Further, a ₹500 crores was allocated towards establishing a Centre of Excellence on AI for education, which aims to increase digital skills and transform the education sector through technology.
Apart from this, the government is also focusing strongly on cybersecurity, hyperscale computation, AI, and blockchain. In India, where data costs only ₹10 per GB, affordable internet is fueling rapid growth in digital innovation.
Wipro Ltd overview
Wipro Limited is a global information technology firm, which is also engaged in consulting and business process services. It mainly operates through its IT services segments, which
delivers solutions across various industry segments.
As of March 2025, this company has a global presence with more than 1,371 active clients across regions like America, Europe, APAC, the Middle East, and Africa. It reported a Large Deal TCV of USD 5.4 billion for FY25 and continues to scale across industries through effective execution.
HCL technologies overview
HCL Technologies is a fast-growing IT services company and its IPO was launched in 1999. The company is engaged in transformational outsourcing and also provides an integrated portfolio of services including software-led IT solutions, remote infrastructure management, research and development, and BPO.
The company operates globally, with a presence in about 60 countries and over 210 delivery centres as of March 2025. On the business front, the company also has partnered with Western Union to transition to an AI-led platform operating model and also won deals for Agentic AI solutions and GenAI-driven documenting the process.
Also Read: Indian Bank stock analysis and expert insights in detail.
Financial Performance
Let us review the financials of both companies for FY25 and figure out which is better, Wipro or HCL:
| Metrics (In ₹ Crore) | Wipro Ltd | HCL Technologies Ltd |
| Revenue | 89,088 | 1,17,055 |
| EBIDTA | 18,021 | 25,504 |
| EBITDA Margins | 20.2% | 21.8% |
| Net Profit | 13,218 | 17,399 |
| Net Profit Margin | 14.8% | 14.9% |
| EPS | 12.54 | 64.12 |
| Dividend | 48% | 94% |
| PE | 19.8x | 25.8x |
| ROE | 16.70% | 25.20% |
| Debt to Equity | 0.23 | 0.09 |
1. Revenue
Revenue is the overall income generated from the company’s business work. Higher revenues are always better as they show larger-scale operations and a healthy client base. HCL Tech reported a revenue of ₹1,17,055 crores and Wipro reported a revenue of ₹89,088 crores, which makes HCL Tech lead under this metric.
HCL Technologies’ saw strong revenue growth driven by its major presence in the US, which contributed 65% of its revenue, a 5.3% rise from last year. Wipro was behind HCL in revenue, mainly due to a 1.8% year-on-year decline in the Americas 2 segment and a 6.9% drop in its European business.
2. EBIDTA
EBITDA shows the core profit for the firm after removing non-operating expenses and EBITDA margin is its percentage in comparison with revenues. Higher EBITDA and EBITDA margins are better for the company. HCL Tech has an EBITDA of ₹25,504 crores with margins of 21.8%, and Wipro has an EBITDA of ₹18,021 crores with margins of 20.2%.
Under this metric, HCL Tech leads. This healthy EBITDA margin can be attributed partly to a reduced workforce, with the employee count decreasing by 1.8% to 2,23,420 as of March 2025. Additionally, the company’s strategy of balancing human resources and AI-driven tools in a 50:50 ratio helps reduce costs.
3. Net profit
Net profit is the final profit earned by the company after removing all the expenses like taxes, costs, etc. A higher net profit is better and it shows healthy financial strength. HCL Tech reported a net profit of ₹17,399 crores with profit margins at 14.9% against Wipro reporting a net profit of ₹13,218 crores with margins slightly lesser at 14.8%, which again makes HCL Tech lead under this metric.
HCL Tech’s profit growth was driven by its focus on AI, delivering 500 GenAI projects for 400 clients and partnering with major tech firms. In contrast, Wipro’s profits were lower due to pricing pressure from cost-cutting and vendor consolidation deals which impacted the margins.
4. EPS
An EPS (Earning per share) shows the profit earned behind each share and a higher EPS is better for the investors. HCL Tech reported an EPS of ₹64.12 as compared to Wipro’s ₹12.54 EPS.
5. Dividend
The dividend payout ratio shows the percentage of earnings distributed to shareholders; a higher ratio is generally more favourable. HCL Tech declared a 94% payout, compared to Wipro’s 48%.
6. PE Ratio
The price-to-earnings ratio is the metric which helps to compare the price in comparison to the earnings of the share. HCL Tech currently has a P/E of 25.8x against Wipro’s P/E of 19.8x. The industry P/E of the IT sector stands at 30x, both companies appear to be trading below sector valuation benchmarks. Notably, Wipro’s lower P/E ratio may indicate a deeper relative undervaluation.
7. Return on Equity
ROE is a metric which helps to understand the return earned on the total equity of the company. A higher ROE signifies strength. HCL Tech has an ROE of 25.20% while Wipro has an ROE of 16.70%.
8. Debt-to-equity ratio
This ratio indicates the level of debt compared to equity. A lower ratio suggests less financial risk. HCL Tech’s debt-to-equity ratio is 0.09, while Wipro is higher at 0.23, mainly due to Wipro carrying ₹19,204 crores in debt.
Also Read: Lemon Tree Hotels stock analysis & expert insights in detail
Stock price performance
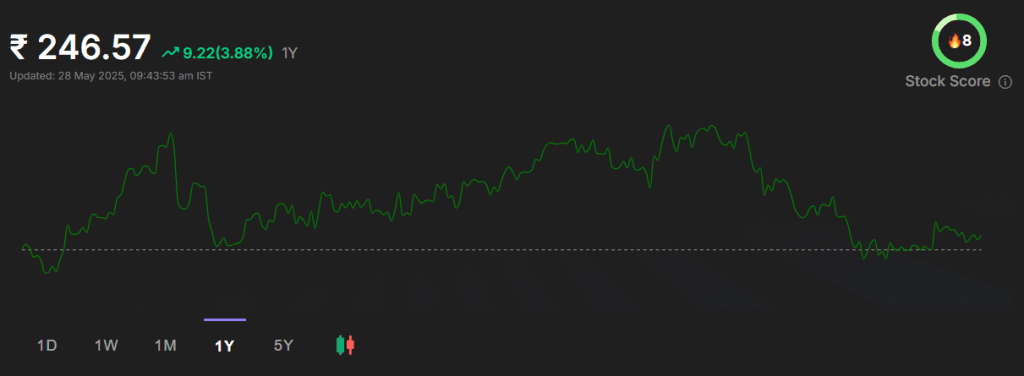
Wipro Ltd was priced at ₹248 on 27 May 2025, with its 52-week high and low at ₹325 and ₹208, respectively.
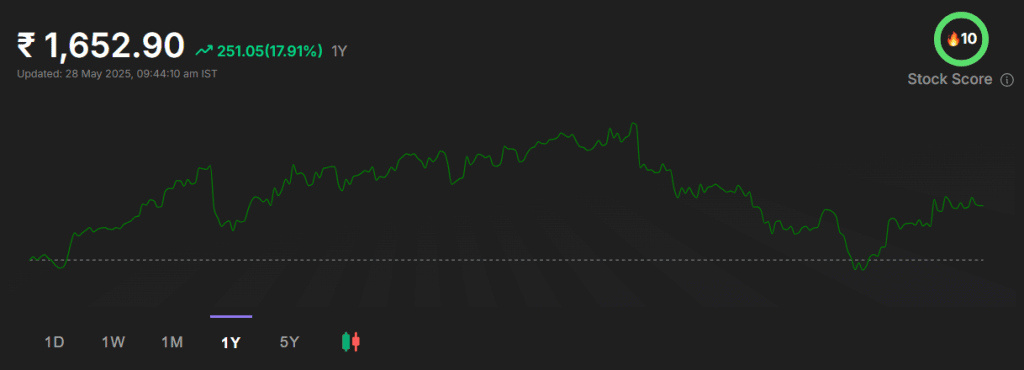
HCL Technologies was priced at ₹1,652 on 27 May 2025, having reached a 52-week high of ₹2,012 and a low of ₹1,235.
Let us have a look at the stock market performance of both companies as of 27 May 2025:
| Returns (As of 27 May 2025) | Wipro Ltd | HCL Technologies Ltd |
| 1 Month | 4.82% | 5.71% |
| 6 Months | -15.36% | -13.07% |
| 1 Year | 9.31% | 21.56% |
| 5 Years | 134.22% | 200.03% |
HCL Tech has sustained substantially higher stock market gains over short and long horizons, nearly doubling in value over the past five years.
Bottomline
HCL and Wipro are key companies in the Indian IT sector. HCL Tech outperforms Wipro financially across most metrics including revenue, profit, EBITDA and other key ratios or stock returns. Wipro holds an advantage only in PE valuation, making it an attractive, undervalued option. As always, investors should monitor market conditions and assess their risk tolerance before deciding which stock aligns better with their investment goals.