Many investors rely on financial statements and broader economic indicators to make decisions. Others lean on chart movements, price patterns, and market signals as in, technical analysis or TA. Each approach offers something different.
What makes one stand out often comes down to timing and clarity. In this blog, we look at the advantages of technical analysis and why it remains a practical choice for many market participants.
What is Technical Analysis?
Technical analysis is the process of interpreting market activity by analysing the historical price action to understand and anticipate future price behaviour. Technical analysis checks patterns formed by price movements like open, high, low, close and volume to make sense of the market.
For example, if a trader looks at Reliance Industries on the NSE, they might use tools like RSI or Relative Strength Index to check if the stock is overbought or MACD to catch a change in momentum and thereby spot potential trading opportunities.
Why Technical Analysis is Popular
The tool is widely used because it works the same way across financial instruments. Whether observing a share on the NSE for intraday trading or tracking a currency fluctuation, the same set of techniques holds. By contrast, fundamental analysis requires a fresh framework each time. This makes it less adaptable.
Technical analysis keeps things efficient. It deciphers market sentiment through price action without relying on external reports. Charts reveal entry signals, while past movements help frame risk boundaries. Even amid volatility, the structure remains intact.
Key Advantages of Technical Analysis
Why do so many traders rely on technical analysis? Let’s break down the key advantages.
Helps Identify Trends Early
Detecting directional changes early can influence how decisions are made in dynamic markets. TA makes this possible by studying repeated patterns in historical trading activity.
- It relies on the idea that price tends to move in identifiable directions over time
- Analysts observe broader phases to forecast whether the market is moving upwards, downwards or staying within a narrow range
- Tools such as moving averages and momentum indicators help highlight changes in direction, often before reversals occur.
Visual and Easy to Interpret
TA is known for its visual nature, which breakdowns how market data is understood and applied. Charts present the price journey clearly, allowing users to spot patterns without needing lengthy calculations or advanced financial knowledge.
Applicable to Any Timeframe
TA adjusts naturally to different market time frames, whether over a few minutes or several weeks. Its focus lies not in the span of observation but in how price responds during that phase.
A short-term trader may focus on intraday changes, while others may study longer cycles. Both apply the same indicators, patterns, and signals.
This continuity across timeframes allows for diverse strategies, making it suitable for varied trading styles without adjusting the core analysis.
Assists in Entry and Exit Decisions
TA helps identify when to enter or exit a trade by analysing price behaviour around key levels. Support, resistance and trendlines highlight potential turning points. Breakouts may suggest entry, while reversals or breaches often guide exit decisions.
Provides Quantifiable Signals
It generates measurable outputs that allow users to understand directional cues and key levels, which generally repeat under similar conditions. With most indicators based on straightforward formulas, signals become much easier to follow and less prone to subjectivity. This clarity supports timely decisions using objective, rule-based criteria directly visible on the chart.
Know more about key technical indicators like RSI, MACD, and more.
Works with Any Asset Class
As noted earlier, TA adapts to any tradable asset where historical movement is recorded. It is not restricted by category or sector. A chart of a pharmaceutical stock, a global currency or a metal future can all be studied through the same lens.
Complements Fundamental Analysis
Fundamentals explore a company’s financial standing, industry dynamics, and economic context. TA, in contrast, interprets how the market responds to that backdrop. While one uncovers structural strength, the other reads investor sentiment through price fluctuations. Their distinct lenses bring balance to evaluation. Combining both helps align conviction with execution.
Supports Quick Decision Making
TA relies on real-time data, allowing traders to respond to market changes without delay. It does not rely on delayed summaries or after-the-fact data. This speeds up the decision process.
Widely Accessible Tools and Data
TA benefits from tools that are easy to find and simple to use across most trading platforms. Most applications include visual aids, historical records and basic indicators without additional cost.
Learning resources have also grown, with options ranging from platform tutorials to open-access content in multiple languages. Many are there for self-paced use, making them suitable across experience levels.
This broad availability reduces barriers. It enables individuals to approach market analysis without large financial investment or institutional access.
Backtesting and Strategy Testing
It allows traders to assess how a strategy would have performed using historical market data. This helps identify strengths and weaknesses before applying it in live conditions.
Through simulation, one can examine performance across varied backdrops, identifying where outcomes remain consistent and where they fall short. It allows adjustments without the pressure of live exposure. While no historical insight guarantees the future, this method encourages refinement based on observed dynamics rather than theoretical assumptions.
Enables Automated Trading
TA provides structured, rule-based inputs that are well suited for automation. With specific rules like entry, exit and stop conditions using indicators, traders can convert strategies into actionable programs. These systems monitor the market continuously and trigger trades when pre-set criteria are met. This helps reduce emotional interference and supports faster execution, especially during volatile conditions or when managing multiple positions.
Flexible for Different Trading Styles
TA adjusts to varied approaches without requiring a change in method or core structure. It supports both rapid trades and longer-term positions through a wide range of tools.
Scalpers may rely on brief intervals and momentum-based setups. Longer-view participants might turn to broader patterns that happen over time. The structure remains open to interpretation, allowing different risk levels and time horizons to be addressed with equal clarity and consistency.
Provides Psychological Market Insight
Market charts often expose more than technical movement. They reflect how participants behave when confidence fades or appetite builds. Accelerated climbs may suggest unchecked optimism. Abrupt pullbacks can signal retreat driven by discomfort or perceived risk. By translating these shifts into visible patterns, technical analysis offers a lens into collective mood.
Real-World Examples of Technical Analysis in Action
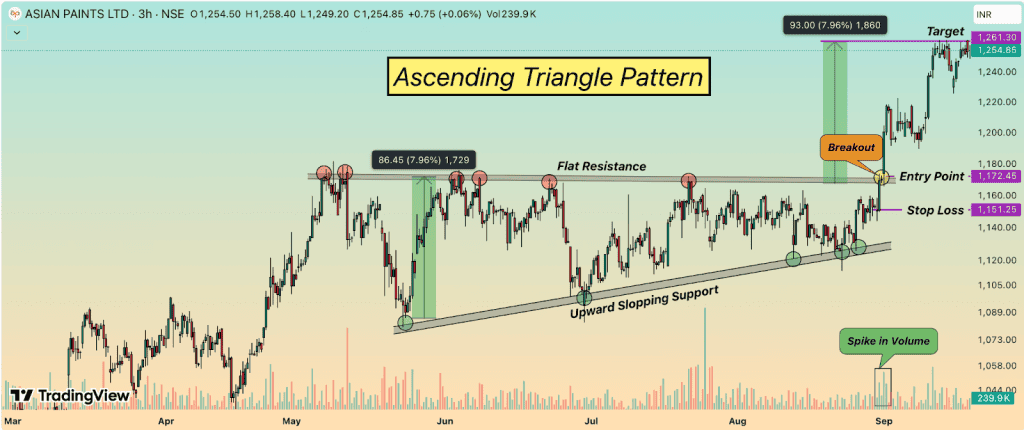
Technical analysis can be better understood through real market scenarios. One commonly observed formation is the ascending triangle pattern. It typically features a horizontal resistance level along with rising support, forming a triangle that depicts consistent upward pressure.
In the price movement of Asian Paints, this pattern became evident over a series of sessions. The price eventually moved above the resistance line, aligning with what is typically seen in a breakout pattern.
In this context, 1,172.45 marked the level where the price crossed resistance, while the support had been forming near 1,151.25. A projected level of 1,261.65 was identified by measuring the height of the triangle and extending it upward from the breakout point.
Trading volume, often regarded as a litmus test in such situations, displayed an uptick during the breakout. That surge offered additional context. In many circles, particularly among those following market structure closely, such volume activity is seen as reinforcing the validity of the move.
Best Practices to Maximize These Advantages
Use technical tools with defined purpose rather than applying indicators without context. Each signal should align with a broader setup. Combining chart-based tools with broader market insights can help filter out weak signals and avoid overreliance on short-term patterns.
Focus on risk control by using stop-loss levels and position sizing suited to your strategy. Pairing technical indicators with fundamentals often results in more balanced and informed trading decisions. By knowing the advantages of technical analysis you need to know limitations which shows how well technical analysis is used.
FAQs
Many look for patterns in price movement to guide decisions. It offers a way to interpret market behaviour without relying solely on external data. Charts become a visual tool, helping some spot entry or exit zones. Others value how it reflects crowd psychology. There’s comfort in structure, especially in fast-moving markets. Not everyone finds it reliable, but for some, it adds clarity. It remains one of several methods used in practice.
Some use it to study past price movements. Others view it as a way to anticipate shifts in momentum. Its usefulness can vary across instruments and timeframes. Not every setup plays out as expected. Markets change, and so do behaviours. A method may work in one phase and fail in another. For many, it’s one part of a broader approach.
New traders often turn to chart-based methods to make sense of market movement. Visual patterns can feel more intuitive than analysing financial statements. Basic setups are fairly accessible and many platforms offer built-in tools to get started. Mistakes are common in the beginning, but they form part of the learning curve. With time and observation, individuals may begin to recognise signals more clearly. Progress depends less on speed and more on steady practice.
Those who operate on shorter timeframes often turn to TA for their trades. When decisions need to be made quickly, there isn’t always room for in-depth research. Some day traders watch patterns throughout the session, focusing more on movement than on company details. In larger institutions, it’s sometimes used alongside other approaches to refine timing. Use varies depending on the strategy in place. It’s based more by intent than by role or background.