Trying to make sense of chaotic intraday price swings? Basic VWAP can fall short when markets react to specific events, not the clock. This is where anchored VWAP can help. Introduced by Paul Levine between 1995 and 1997, this enhanced version lets you start tracking price and volume from a meaningful point like a breakout, a gap, or an earnings release. It’s a way to bring context back into your charts and make trading decisions that align better with what’s actually moving the market. Let’s learn about it in detail now.
What is Anchored VWAP?
Anchored VWAP is a type of VWAP indicator that allows users to set a specific time and price level as an anchor point, or starting point. This anchor can be a high, low, or significant event on the chart. It helps track price movement more precisely around key levels, offering a more focused view of buying and selling activity.
How Does Anchored VWAP Work?
Once you set an anchor point, the Anchored VWAP calculates the average price from that moment onward, updating continuously as trades happen. Instead of starting fresh each day, it keeps building from the chosen level, showing how price and volume have behaved since that point. The line adjusts as new data is added, giving an ongoing view of buying and selling activity. It doesn’t reset daily, which makes it helpful for observing reactions beyond a single session.
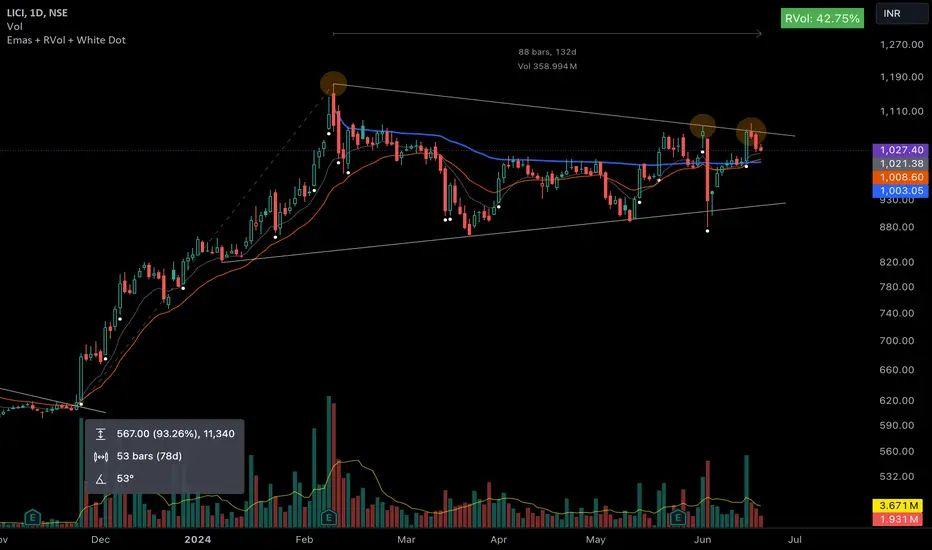
For example, the chart for LIC below shows the blue Anchored VWAP line starting from the major high in February 2024. Since then, it has acted like a ceiling, stopping price moves in May and June. It shows where most trading happened after the peak, creating a strong resistance.
Anchored VWAP vs Traditional VWAP
While both technical indicators use price and volume to show average trading levels, the main difference lies in how and when their calculations begin. The comparison is shown below:
| Feature | Traditional VWAP | Anchored VWAP |
| Starting point | Begins at start of trading day | Set by user at a chosen event or time |
| Timeframe | Limited to intraday | Can cover several days or weeks |
| Flexibility | Fixed and session-based | More adaptable to different scenarios |
| Application | Tracks daily price movement | Focuses on specific event reactions |
So, briefly put, anchored VWAP offers more control over the starting point, while traditional VWAP resets daily.
How to Choose an Anchor Point
The factors to consider while selecting an anchor point for using anchored VWAP effectively have been displayed below:
- Use a visible high or low like a swing point or major reversal area to mark meaningful price reactions.
- Choose a date-based anchor such as the start of a week, month, or year to track how price performs from that moment.
- Anchor to pivot points based on previous highs, lows, and closes to reflect key levels.
- Use event-based anchors like earnings releases or major news that may have influenced price.
- Pick an anchor that aligns with your strategy and time frame.
How to Calculate Anchored VWAP
To calculate anchored VWAP, first choose a specific point on the chart like a high, low, or event and then track the average price from that point, weighted by volume. This shows how the stock has behaved since that moment. The formula is:
Anchored VWAP = Σ(Price × Volume) / ΣVolume
Here, price refers to each transaction, and volume is the number of shares traded. The result shows the average price paid per share, offering a clear view of whether buyers or sellers are more active since the anchor point.
For example, suppose you anchor from a candle where the following three trades occur:
- 100 shares at ₹150
- 200 shares at ₹152
- 300 shares at ₹151
Now calculate: Σ(Price × Volume) = (150×100) + (152×200) + (151×300) = 15,000 + 30,400 + 45,300 = 90,700
Σ(Volume) = 100 + 200 + 300 = 600
Anchored VWAP = 90,700 / 600 = ₹151.17
So, ₹151.17 becomes the anchored average price since that point, serving as a reference level for tracking future price behavior.
Anchored VWAP Trading Strategies
Anchored VWAP can be used in several ways to track price reactions around important levels. The strategies commonly are as follows:
- Anchor from significant events
Use points like earnings announcements, product launches, or sharp price movements to start the VWAP. This helps you observe how price behaves after these key events.
- Use as support or resistance
The anchored VWAP line often acts as a level where price either holds or stalls. Watching how price reacts near this line can highlight areas where buying or selling interest appears.
- Identify strong price moves
A clear move above or below the anchored VWAP can show which side buyers or sellers are currently more active, helping spot opportunities to enter or exit.
- Combine multiple anchor points
Applying anchored VWAPs from different events or timeframes, like the week’s high or month’s low, helps find overlapping levels that can act as stronger support or resistance zones.
How to Trade and Interpret Anchored VWAP
To read and trade using the anchored VWAP, observe how the price behaves around the line:
- When price stays above the anchored VWAP, it reflects stronger buying interest.
- When price remains below the anchored VWAP, sellers are likely dominating.
- In up moves, the anchored VWAP may act as support, where price often finds a base.
- In down moves, the line may act as resistance, blocking upward moves.
- If price remains steady above the anchored VWAP line, it indicates ongoing demand from buyers.
- If it stays below, it signals continued selling pressure.
- A cross from below to above the line may suggest a reversal upward.
- A cross from above to below may signal a possible reversal downward.
This helps spot important price zones and reactions after anchoring to a specific point.
How to Set Stop Losses with Anchored VWAP
The stop loss approach varies based on whether you’re taking a bullish or bearish position:
- In a bullish setup: Place the initial stop loss slightly below the Anchored VWAP to protect against downward reversals.As price moves up, trail the stop loss just below each new higher low to lock in profits gradually.
- In a bearish setup: Set the initial stop loss just above the Anchored VWAP to avoid sharp upward spikes. As price continues to drop, adjust the stop loss above each lower high to secure gains while allowing room for the move.
Identifying Breakouts/Breakdowns
A breakout happens when price moves above Anchored VWAP after staying below, showing renewed buying interest. Volume spikes or indicators like RSI can be used for confirmation before entering long trades. A breakdown occurs when price falls below the Anchored VWAP after being above it, showing rising selling interest. Look for confirmation through patterns or support breaks before shorting. This helps in filtering out false moves and understanding if the market is accepting new prices above or below the anchored line.
Using Anchored VWAP as Support/Resistance
Anchored VWAP usually acts like shifting zones of support or resistance. When price is above it, the line may act as support, offering entries on pullbacks. When price is below, it may act as resistance, where price reacts and moves lower. This dual role gives a reliable way to track how price interacts with key areas. It also helps in setting up exits or entries based on whether price holds or crosses the anchored line.
Multiple Anchored VWAPs
Adding several anchored VWAPs from diverse points, such as recent peaks, dips, or major moves, helps map out support and resistance levels across multiple time views. Also, anchoring it to selective moments, such as a recent weekly top or a monthly low, can reveal zones where trading interest was strong. When many anchored VWAP lines cluster around one price, it may highlight a strong area where buyers and sellers converge across time frames. This approach offers a more detailed read on price behavior, helping traders fine-tune entries and exits.
Pros and Cons of Anchored VWAP
There are various pros and cons of anchored VWAP to be aware of. Some of its pros include:
- Allows users to start the calculation from a meaningful price or time level, avoiding distortion caused by early trading noise.
- Gives a focused view of how the market behaved after a key event or turning point, helping traders assess market strength more clearly.
- Suitable for all time ranges, daily, weekly, or monthly, making it useful for both quick trades and long-term plans.
- Helps identify zones where buyers or sellers have shown strong interest, which can be useful in planning entries or exits.
- Works well alongside other tools like RSI, moving averages, and support/resistance lines for deeper market analysis.
Despite its widespread benefits, it accompanies certain limitations:
- The choice of anchor point is subjective and can vary widely, which may affect consistency across different users.
- Needs to be updated as new significant events or highs/lows emerge, or it may lose relevance.
- May produce misleading levels in illiquid or highly volatile conditions, reducing reliability.
- Can be skewed by outliers, such as sudden spikes or crashes during the anchor period, which may distort its reading.
Conclusion
Price doesn’t always move on a fixed schedule and neither should your analysis. Anchored VWAP allows you to lock onto the moments that actually move markets, offering a clearer view beyond daily resets. For anyone looking to filter out distractions and focus on core levels, anchored VWAP brings timing and context together on one line.
FAQs
Anchored VWAP offers more flexibility than standard VWAP by letting you set a specific starting point, such as a major high, low, or event. This makes it useful across multiple timeframes, while standard VWAP resets daily and is mainly intraday-focused.
In order to use anchored VWAP, select the indicator on your chart and click on a specific candle or event to anchor the calculation. The AVWAP line will then plot from that starting point forward, tracking price and volume together.
Yes, beginners can use anchored VWAP easily, as it is available on many platforms and requires only selecting a meaningful anchor point. Most traders use it for spotting main average price levels, support, or resistance over time.
Anchored VWAP works well for swing trading, since it tracks average price from any chosen point, including earnings or news. This allows traders to monitor price action and important levels over days, weeks, or even months.
Anchored VWAP is seen as reliable for identifying key price zones and sentiment after specific events, especially when combined with other signals. Its accuracy depends on the strength of the anchor selected and additional confirmation, rather than being foolproof alone.