Summary
Moving averages are everywhere on trading charts but most of them share the same frustrating problem: they’re either too slow and lag behind the price, or too fast and whipsaw you into bad trades.
ALMA was designed to fix that. It uses a Gaussian filter to smooth price data with minimal delay, giving you a cleaner trend line that reacts faster without the noise. Here’s how it works and why it might deserve a spot on your chart.
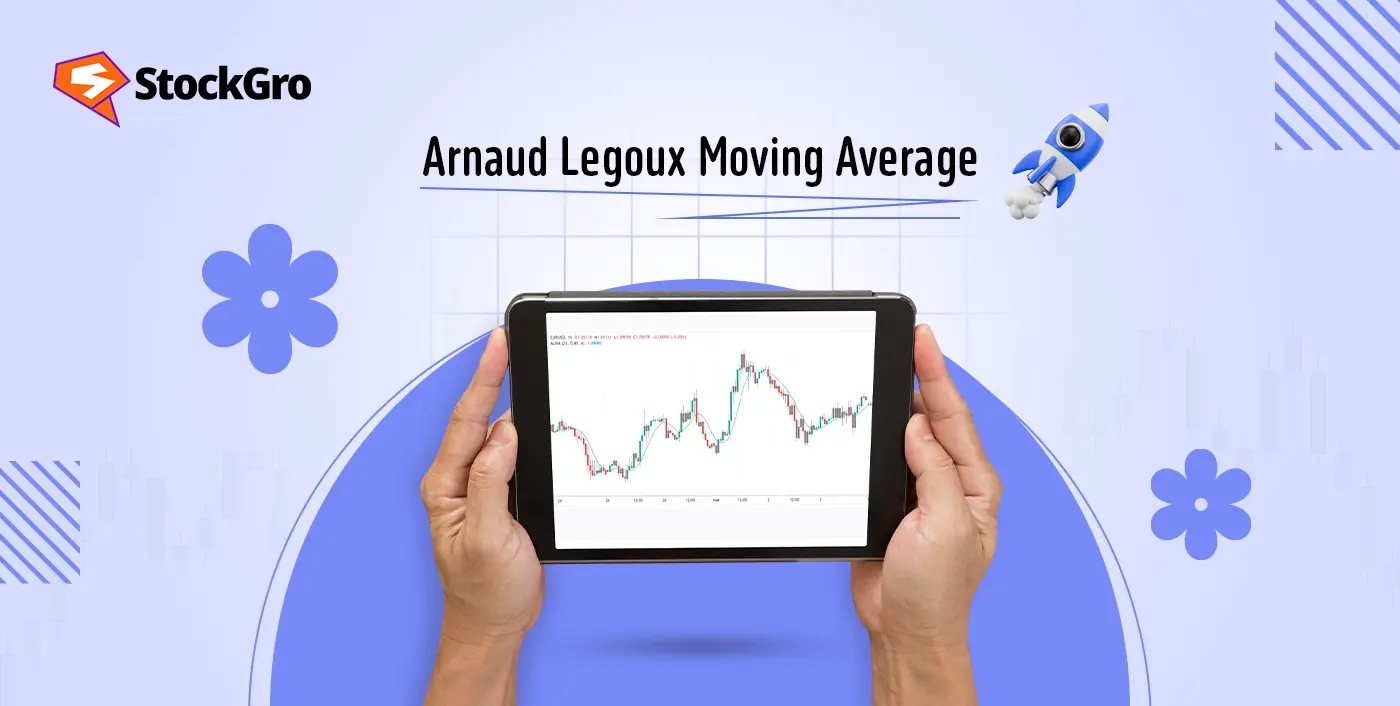
What is the Arnaud Legoux Moving Average (ALMA)?
ALMA is a type of moving average that applies a Gaussian distribution curve (a bell curve, basically) to weight the prices in its calculation. Unlike a simple moving average that treats every price bar equally, or an exponential moving average that front-loads the most recent prices, ALMA lets you control where the bell curve peaks meaning you decide how much weight goes to recent data versus older data.
The result is a moving average line that hugs price more closely than an SMA, reacts faster than most EMAs, and produces significantly fewer false crossovers during choppy, sideways markets. If you’ve ever been frustrated by your 20-period EMA flipping bullish and bearish three times in an hour during a range-bound session, ALMA addresses exactly that problem. It smooths the noise without introducing the kind of lag that makes you late to every move.
Who Developed the ALMA?
ALMA was created by Arnaud Legoux and Dimitris Kouzis-Loukas. They published the indicator in the early 2010s with a specific goal building a moving average that minimised both lag and noise simultaneously. Most moving averages force you to choose between the two. Want less lag? Use a shorter period or an EMA but you get more noise. Want less noise? Use a longer SMA but you get more lag. Legoux and Kouzis-Loukas used the Gaussian filter approach to break that trade-off.
The maths behind it draws from signal processing a field that deals with cleaning up noisy data in engineering and physics. They essentially borrowed a technique from a completely different discipline and applied it to financial price data. That cross-pollination is part of why ALMA behaves differently from other moving averages that were all built within the same framework of simple weighted calculations.
How the ALMA Indicator Works in Trading
ALMA uses three parameters: window size (period length), offset (where the Gaussian curve peaks, usually set between 0 and 1), and sigma (how wide the bell curve spreads). The default settings most platforms use are window 9, offset 0.85, and sigma 6.
Here’s what those numbers do in plain terms. The window is your lookback period 9 means ALMA considers the last 9 price bars. The offset controls responsiveness: 0.85 means the curve’s peak sits closer to the most recent prices (making ALMA faster), while 0.5 would weight old and new prices equally (making it smoother but slower). Sigma controls how sharp the curve is a higher sigma creates a wider, smoother bell; a lower one creates a tighter, more reactive curve.
ALMA = Σ [Price(i) × Gaussian Weight(i)] ÷ Σ [Gaussian Weight(i)]
In practice, you don’t need to compute this yourself every platform handles it. What matters is understanding that the offset parameter is your main tuning dial. Bump it towards 1.0 for faster reaction, pull it towards 0.5 for smoother signals. On a 5-minute chart of Nifty, an ALMA with window 9, offset 0.85, and sigma 6 tracks intraday swings tightly while filtering out the micro-noise that drives standard EMAs crazy.
ALMA vs SMA vs EMA: Which Moving Average Is Better?
| Feature | SMA | EMA | ALMA |
| Calculation method | Equal weight to all prices in the period | Heavier weight on recent prices | Gaussian bell curve with adjustable peak |
| Lag | Highest slowest to react | Moderate reacts faster than SMA | Lowest designed to minimise delay |
| Noise filtering | Good at smoothing but at the cost of lag | Moderate faster but noisier | Best smooth without proportional lag increase |
| False crossovers | Fewer (but signals arrive late) | More common in choppy markets | Fewest Gaussian filter reduces whipsaws |
| Best for | Long-term trend identification | Swing and momentum trading | Intraday and swing trading where timing matters |
| Customisation | Period only | Period only | Period + offset + sigma three tuning dials |
| Popularity | Universal on every platform | Universal default for most traders | Growing available on TradingView, MT4/5 |
None of these is universally “better” they solve different problems. But if your main frustration is getting whipsawed during flat sessions while still wanting fast signals during trending moves, ALMA handles that balance better than either SMA or EMA.
Best ALMA Trading Strategies for Beginners and Active Traders
ALMA crossover with price: The simplest approach. When the price crosses above the ALMA line, go long. When it drops below, exit or go short. On a 15-minute chart of Bank Nifty using ALMA (9, 0.85, 6), this generates cleaner signals than a standard 9-EMA crossover because ALMA filters out the small dips and blips that trigger false crosses. Say Bank Nifty is at ₹50,200 and crosses above ALMA at ₹50,150 you enter long with a stop at ₹50,050 (₹150 risk) and target ₹50,500 (₹300 reward). Clean 1:2 setup.
Dual ALMA strategy: Use two ALMAs with different settings a fast one (window 9, offset 0.85) and a slow one (window 21, offset 0.85). When the fast ALMA crosses above the slow ALMA, that’s a bullish signal. When it crosses below, bearish. This works particularly well on daily charts for swing trades because the dual filter catches trend changes with fewer whipsaws than a standard dual-EMA system. The key is patience wait for a confirmed cross, not just a touch.
How Traders Use ALMA for Smarter Risk Management
ALMA doubles as a dynamic stop-loss level. Instead of setting a fixed stop at ₹50 below your entry, trail your stop along the ALMA line. As long as price stays above ALMA in a long trade, the trend is intact. When price closes below ALMA, the trend may be shifting and it’s time to exit. This keeps you in strong trends longer than a fixed stop would and gets you out faster during genuine reversals.
Here’s a quick example. You buy Reliance at ₹2,920 when it crosses above the ALMA line on a daily chart. Over the next eight sessions, the stock climbs to ₹2,985 and ALMA tracks upward to ₹2,960. Your trailing stop sits at ₹2,960 protecting ₹40 of profit per share. If Reliance dips to ₹2,958 and closes below ALMA, you exit. Without the ALMA trail, a fixed stop at ₹2,870 would have given back ₹90 of profit before triggering. The dynamic approach locks in gains as the trend matures.
Common Mistakes Traders Make While Using ALMA
Using default settings on every timeframe: Window 9 with offset 0.85 works well on daily and 15-minute charts, but it might be too reactive on a 1-minute chart or too slow on a weekly chart. Test the settings on your specific timeframe before trading real money what works on one chart can produce garbage on another.
Treating ALMA crossovers as standalone signals: ALMA is a trend filter, not a complete trading system. A price-above-ALMA signal in a range-bound market is just noise. Always confirm with volume, support/resistance, or a momentum indicator like RSI before entering.
Constantly tweaking the offset and sigma: Some traders adjust the parameters after every losing trade, hoping to find magic numbers. There aren’t any. Pick settings that suit your timeframe, trade them for at least 30–50 sessions, and evaluate. The learning happens through consistency, not through endless optimisation.
Ignoring the broader trend: A bullish ALMA crossover on a 5-minute chart means little if the daily chart shows a clear downtrend. Always check the higher timeframe first. Trading against the bigger trend, even with a clean ALMA signal, usually ends badly.
Why ALMA Is Becoming Popular Among Modern Retail Traders
Two reasons, really. First, platforms like TradingView made it accessible. Five years ago, ALMA wasn’t available on most charting tools you had to code it yourself. Now it’s a built-in indicator on TradingView, MetaTrader 4/5, and several Indian broker platforms. That accessibility lowered the barrier from “quant-level programmer” to “anyone who can click ‘add indicator.'”
Second, retail traders are getting more sophisticated about signal quality. The era of slapping a 50-day SMA on a chart and calling it analysis is fading. Traders who’ve been burned by EMA whipsaws during choppy Nifty sessions are actively looking for tools that filter better without lagging more. ALMA fits that need precisely. It’s not magic but it does solve a specific, widely felt problem better than the tools most people are currently using.
How to Add ALMA to Your Trading Platform
On TradingView: Open your chart, click “Indicators” at the top, search “ALMA” it shows up as “Arnaud Legoux Moving Average.” Click it, and it appears on your chart with default settings (usually window 9, offset 0.85, sigma 6). To adjust, click the gear icon on the indicator label and change the parameters. Takes about fifteen seconds.
On MetaTrader 4/5: ALMA isn’t built-in by default on MT4/MT5. You’ll need to download a custom indicator file (.mq4 or .mq5) from the MQL5 community library there are several free versions. Drop the file into your platform’s Indicators folder, restart the platform, and it’ll appear under “Custom Indicators” in the Navigator panel. Slightly more steps than TradingView but still manageable.
Conclusion
ALMA won’t turn losing trades into winners on its own no indicator does that. What it will do is give you a cleaner trend line that reacts faster and whipsaws less than the moving averages you’re probably already using. If you’ve been frustrated by your EMA generating three false crosses during a flat afternoon session, try swapping it for an ALMA with the same period and see what changes. Start on a paper account, test it for a few weeks, and let the results not the theory tell you whether it belongs on your chart permanently.
FAQs
It applies a Gaussian bell curve to weight prices in its lookback window, with the peak position and width controlled by offset and sigma parameters. This produces a moving average with less lag and fewer false signals than SMA or EMA.
Not universally, but it handles the lag-vs-noise trade-off better. ALMA filters choppy price action more effectively while still reacting quickly to genuine trend changes which makes it particularly useful for intraday and swing trading.
Window 9, offset 0.85, sigma 6 is the standard starting point and works well on most timeframes. For slower, smoother signals, try window 21 with the same offset. Always test on your specific chart before using real capital.
Yes. ALMA performs well on 5-minute and 15-minute charts because its Gaussian smoothing filters out intraday noise without the lag that makes standard moving averages too slow for short-term trading.
RSI for overbought/oversold confirmation, VWAP for intraday trend bias, and volume for validating whether a crossover has real participation behind it. A dual-ALMA setup (fast + slow) also works well as a standalone system.