It’s easy to get caught on the wrong side of the market when a strong uptrend suddenly turns bearish. Such unexpected reversals can result in quick losses, especially for short-term traders. The bearish kicker candlestick pattern acts as an early alert for sudden negative sentiment shifts. Known for its clear and aggressive price action, this pattern often marks the start of strong downward movement. This blog discusses its structure and usage in detail.
What is a Bearish Kicker Pattern?
The bearish kicker is a two-candle formation that suggests a sharp change in price direction. It often appears after an uptrend. A bullish candle is followed by a sharp gap down, with the next candle pushing further downward. The visual contrast between the two candles signals a possible reversal in momentum.
Bearish Kicker Candlestick Pattern – Formation
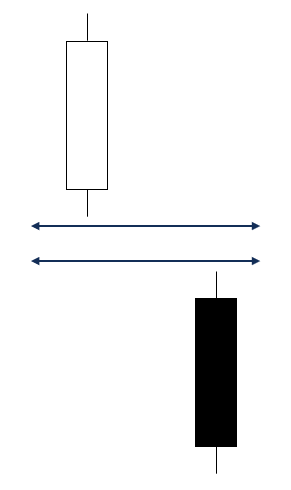
This pattern forms only when two specific candle conditions appear together. Here’s what to look for:
- First candle: A strong green candle (bullish), often with a large body and minimal wicks.
- Second candle: A red candle (bearish) that opens with a gap down and closes even lower, also with a large body and short wicks.
This candlestick pattern is more important if it appears during an uptrend, as it shows a stronger shift in market direction.
What are the Characteristics of a Bearish Kicker Pattern?
This pattern often points to a sharp shift in market behavior.
- It commences with a strong green candle, followed by a red one that opens lower and continues declining.
- The gap between the candles highlights a sudden change in sentiment.
- Both candles are long, indicating clear strength from buyers first, then sellers.
- Often formed after a strong rally.
- High trading volume may accompany the pattern, showing increased market activity.
What is an Example of Bearish Kicker Pattern?
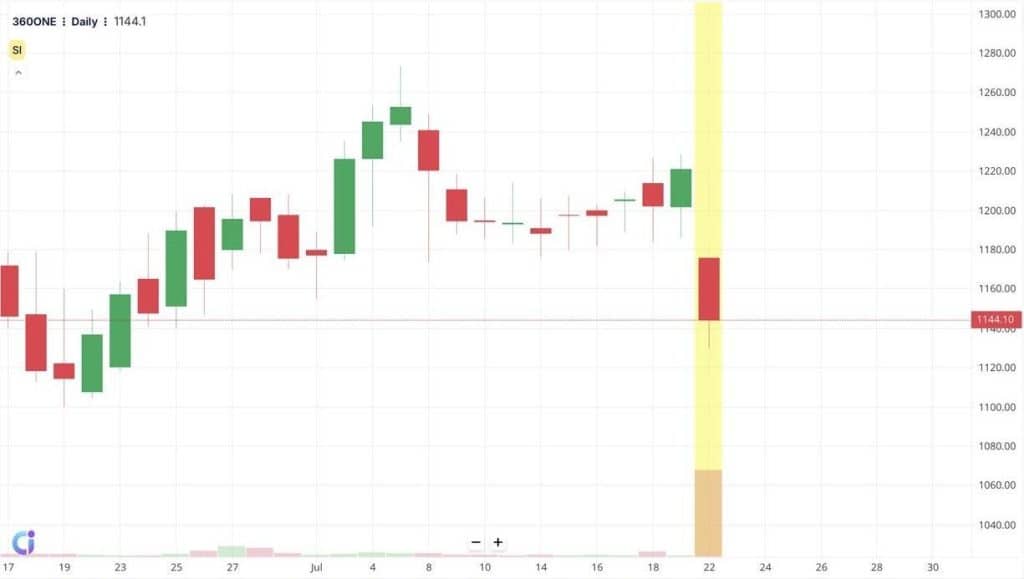
For example, take 360ONE WAM Ltd, formerly known as IIFL Wealth Management, on 22 July 2025. The stock dropped by 6.31%. You can spot a clear gap between the previous day’s bullish close and the next day’s bearish open. The red candlestick that follows shows strong downward movement, marking a clear break in buying strength, this forms a classic bearish kicker candlestick pattern.
Bearish Kicker Candlestick Pattern – Trading Ideas
Once a bearish kicker forms during an uptrend, traders often use the following approach to manage entries, exits, and risk:
- Entry: Think about entering a short trade if the price drops beneath the second candle’s closing level.
- Target: Exit the trade near the next visible support zone. Partial profits can also be taken here, while holding the rest for extended downside.
- Stop Loss: To manage risk, a stop-loss can be positioned near the upper wick of the first candle.
How Does the Bearish Kicker Work
The bearish kicker works as a two-day pattern that reflects a clear change in market behavior. The formation starts with a bold upward candle, followed by a bearish one that gaps higher but quickly loses ground. This move often signals that sellers have taken control, rejecting earlier buying interest. The sudden reversal shows that the market may no longer support higher prices, making the pattern useful for spotting early signs of negative sentiment.
What Does Bearish Kicker Indicate?
This pattern points to a sudden shift from buying to selling pressure. The strong bearish candle follows a bullish one, implying a shift in control from buyers to sellers. It often appears after a period of upward movement, where optimism is quickly replaced by selling activity. The gap between the two candles emphasizes the strength of this reversal. While traders may take notice of this pattern during strong market reactions, it is often seen as an early sign of bearish momentum
How to Confirm the Bearish Kicker Pattern
To strengthen the reliability of the bearish kicker, traders often seek assistance of these supporting indicators:
- Moving Averages: A moving average tracks the average price over a period. If the bearish candle forms below key averages, it may reflect weakening price direction.
- RSI: The Relative Strength Index (RSI) tracks the pace and direction of price changes on a scale from 0 to 100. A drop from above 70 following the pattern often points to fading buying strength.
- ADX: An average directional index tracks the strength behind price moves. A declining ADX after the pattern can highlight loss of previous force.
- Volume: Volume represents the total number of shares exchanged during a trading session. High volume on the bearish candle often aligns with stronger downside movement.
How to Use Bearish Kicker Pattern for Trading?
This pattern often marks the beginning of strong price movement. Here’s how traders commonly approach it:
- Short selling: Sell borrowed shares after confirmation and aim to buy back at a lower price.
- Stop-loss placement: Set the stop-loss slightly above the second candle to reduce downside exposure.
- Spreading exposure: Allocate trades across different sectors or stocks to limit overdependence on a single outcome.
- Use with indicators: Combine with volume or trend like top indicators to confirm strength.
- Quick execution: Take action soon after the second candle forms to capture the price move early.
When the Bearish Kicker Pattern May Fail
The bearish kicker candlestick pattern can lose reliability under certain conditions:
- If the second candle closes above the opening gap, the setup weakens.
- When the gap is quickly filled, it may show that sellers aren’t fully in control.
- If the second candle forms with low volume, the price action may not carry enough strength to continue..
Bearish Candlestick Kicker Pattern vs Bullish Kicker Candlestick Pattern
Kicker patterns come in two forms. Bearish and bullish kicker pattern. Both involve sharp price moves, but in opposite directions. Here’s how they differ:
| Bullish Kicker | Bearish kicker |
| Forms during a falling market | Forms in a rising market |
| First candle is bearish | First candle is bullish |
| Second candle opens higher and moves up strongly | Second candle opens lower and declines sharply |
| Buyers take over from sellers | Sellers take over from buyers |
These patterns are known for their strong follow-through and are used to observe changes in market behavior.
Significance of Bearish Kicker Candlestick Pattern
This pattern is known for its clear price movement and is often watched closely by traders for better technical analysis.
- Clear downward move: The two-candle structure creates a sharp contrast between buying and selling pressure, making it easy to notice.
- Strong price reaction: The strong move often leads to sustained selling activity, as it reflects a firm rejection of earlier price levels.
- Flexible across timeframes: Whether on daily, hourly, or weekly timeframes, the pattern maintains its clarity and usefulness.
- Defined action points: It offers straightforward levels for price entry and exit based on the size and placement of the candles.
Advantages and Disadvantages of Bearish Kicker Pattern
The bearish kicker pattern is more effective in certain market conditions:
- When it appears near a resistance level, it often draws selling interest, as many expect prices to pull back.
- At all-time highs, it reflects hesitation among buyers, leading some to exit positions and lock in profits.
- If the RSI indicates overbought conditions, this pattern might reinforce downside pressure.
However, it comes with limitations too:
- It doesn’t occur very often.
- Large price gaps can be caused by external events, not just market behavior.
- It can mislead without confirmation from other indicators or patterns.
- On shorter timeframes, noise may affect its reliability.
What are Other Types of Bearish Patterns?
Apart from the bearish kicker, several candlestick patterns also reflect downside pressure:
- Bearish engulfing: A small green candle is followed by a large red candle that completely covers it. This shows sellers have overpowered buyers and could lead to more price drops.
- Dark cloud cover: A red candle begins above the prior green candle but ends below its halfway point. It shows buying interest has faded and sellers are stepping in.
- Hanging man: Often shows up after an upward trend, with a tiny body and a long tail below. It reflects that selling increased during the session.
- Evening star: A three-candle pattern showing buyers losing ground to sellers over successive sessions.
- Three black crows: Three long red candles form consecutively, each closing near its low, highlighting firm downward movement.
FAQ
The bearish kicker pattern can be observed on intraday charts such as 5-minute, 15-minute, or hourly intervals. While its core characteristics remain the same, patterns on shorter timeframes might be influenced by increased volatility and market noise, affecting clarity and reliability.
In financial markets, bearish refers to the expectation or belief that the price of an asset, security, or the market as a whole will decline. A bearish sentiment reflects pessimism regarding the future direction of a particular instrument, often leading to selling pressure. The term is commonly used to describe market trends, investor attitudes, and specific chart patterns that forecast or confirm downward price movement.
The kicker pattern can be either bullish or bearish, depending on the direction of the price reversal. A bearish kicker suggests a possible downward reversal after an uptrend, while a bullish kicker signals an upward move after a downtrend. Its designation depends on market context.
The reliability of the kicker candlestick pattern varies among analysts and depends on factors like timeframe, asset, and market context. While some see it as a strong reversal indicator, it should not be considered foolproof, as effectiveness can differ across situations and supporting signals.
In order to confirm the pattern you can typically check that the second candle opens with a decisive gap in the opposite direction and that both candles have strong bodies. Increased volume and subsequent price movement in the same direction can also provide additional confirmation, though standards may differ.
The bearish kicker is specific to candlestick charts because it relies on the relationship between open, close, and gaps between candles. Such characteristics are not displayed on line or bar charts, making this pattern exclusive to candlestick representations.
Yes, the term “bearish” applies to line charts as it simply denotes a downward movement or negative trend in prices. However, specific candlestick patterns like the bearish kicker cannot be identified on line charts, which lack open and close detail.
Whether a bearish kicker is better than a bullish kicker depends on context and perspective. Each pattern signals a sharp change in direction one to the downside, the other to the upside and their usefulness is determined by trading goals and the market scenario.
The bearish kicker and bearish engulfing are both reversal patterns, but they differ visually and in formation. The kicker involves a gap between two contrasting candles, while engulfing shows a bearish candle fully covering the previous bullish candle’s body. Both indicate potential reversals, but their signals and appearance are distinct.