Among candlestick patterns, the spinning top stands out for what it does not say outright. There’s no precise trigger, no textbook entry or exit. However, what it shows is a tension, a tug-of-war between buyers & sellers with no clear winner.
Depending on context, it may lean bearish or bullish. In the following discussion, we turn to the Bearish Spinning Top candlestick pattern, to understand what this moment of indecision might reveal about the market’s next move.
What is a Bearish Spinning Top Candlestick Pattern?
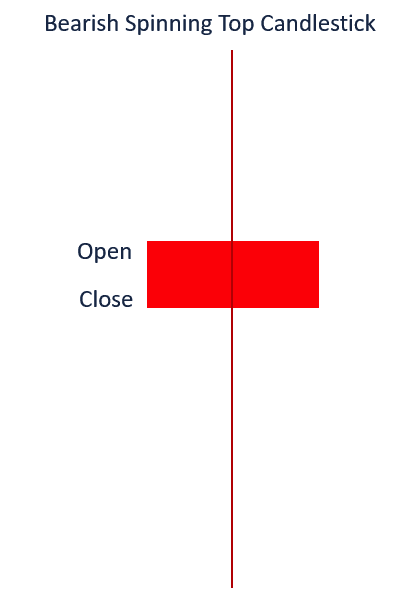
It is a candlestick with a small body and long upper & lower shadows. It shows that buyers and sellers were active but neither gained full control.
The candle opens at a higher price and closes lower, which reflects slight selling pressure. This pattern often appears during or after a strong price move. It signals market uncertainty and may hint at a reversal.
How is a Bearish Spinning Top Formed?
This pattern is seen when bullish momentum starts to fade. Here’s a look at how it’s formed:
- The session opens with upward bias.
- Prices rise above the opening level but during the same session, it also falls below it.
- Due to this fluctuation, long upper and lower shadows are seen.
- The candle closes slightly below the opening price, leaving behind a small real body.
What Does a Bearish Spinning Top Indicate?
It shows uncertainty in the market after an upward trend. It does not confirm a reversal, but it questions continuation.
The candle forms when prices rise and fall during the session, but close near the opening level. The long upper wick suggests buyers tried to push prices higher but failed. Moreover, the lower wick shows sellers also tested lower prices but could not keep control.
In this tension, a potential change might take place. However, it does not confirm a trend reversal, it often warns that bullish momentum is weakening and sellers may start gaining ground.
How to Identify a Bearish Spinning Top on a Chart?
- Begin with a candlestick chart. Line or bar charts will not show the detail this pattern requires.
- Locate a session where the candle body is short and with both upper & lower shadows of similar length.
- Confirm that the close is below the open. This subtle difference helps distinguish bearish intent.
- If it shows up near a recent high, take note. It may be an early sign of pressure changing hands.
- Use charting tools to assist, but rely on structure first.
How to Confirm a Bearish Spinning Top?
Confirmation depends on what happens next and not the candle itself. Consider the following to add context:
EMA (Exponential Moving Average)
It helps track short-term price trends. If the spinning top forms near or just below the EMA, it may suggest that the recent upward move is losing strength. Plus, if a candle that closes below both the EMA and also the spinning top may provide additional context within the larger movement.
RSI (Relative Strength Index)
RSI measures momentum. When the price forms higher highs but RSI forms lower highs, this is called bearish divergence. If this happens before or during the spinning top, it may point to reduced buying strength.
MACD (Moving Average Convergence Divergence)
MACD tracks momentum shifts. When the MACD line crosses below the signal line after a spinning top, or when the MACD shows divergence from price, some observers read this as a sign that bullish momentum may be weakening.
How to Trade the Bearish Spinning Top Pattern in Technical Analysis?
As noted earlier, the candle signals market ambiguity. Hence, acting on the spinning top alone is not sufficient in technical analysis. Therefore it’s good to wait for a confirmation candle and make a plan of action. Since it’s a bearish version, look for a strong red candle that closes below the pattern’s low, suggesting that sellers are starting to take control.
To add more perspective, use this setup with additional tools like volume, resistance zones or other technical indicators. Next, if a position is taken after confirmation, a stop loss is typically placed above the pattern’s high. A defined profit target may help maintain a balanced risk-to-reward approach.
Best Timeframe to Trade Bearish Spinning Top
Timing plays a key role in how this formation is understood. Its relevance often shifts depending on the broader trend cycle.
Longer sessions, such as daily charts, tend to smooth out intraday volatility. Movements here are more likely to reflect sustained sentiment rather than brief reactions. Mid-range durations, like the four-hour or hourly scale, may reveal short candle setups more frequently. However, those readings often require further input from volume or structure.
At the lower end, such as 15-minute intervals, signals may appear in quick succession. In fast-moving markets, these patterns can be harder to filter without additional context.
When the Bearish Spinning Top May Fail
This pattern does not always produce a meaningful outcome. Its presence alone cannot confirm directional change.
- In sideways or range-bound markets, the pattern often appears without leading to a clear move. It may reflect normal fluctuation rather than a turning point.
- Without confirmation from a strong bearish candle, early entries based solely on this formation can lead to misjudged trades.
- Relying on it in isolation may fail. Volume, resistance levels and other supporting indicators are often needed to improve reliability.
Bearish Spinning Top vs Bullish Spinning top
Both patterns look the same. The difference lies in where they appear and what comes before them.
| Aspect | Bearish Spinning Top | Bullish Spinning Top |
| Trend before pattern | Forms after an uptrend | Appears after a downtrend |
| Market message | Bulls are slowing down or losing control | Bears are struggling to push lower |
| What it may signal | A possible pause or start of a move lower | A potential shift toward buying pressure |
| Where it shows up | Near recent highs or resistance zones | Close to support or recent lows |
| Needs confirmation | Yes, often a strong red candle to suggest sellers are stepping in | Yes, usually followed by a green candle showing buyer strength |
Related Bearish Reversal Patterns
Beyond the spinning top, several other candles carry reversal potential when they appear at the end of a rising phase.
- Hanging Man: The Hanging Man appears after an upward trend. It reflects a session where price dropped sharply, then recovered by the close. This recovery, however, may signal fading buying interest rather than strength.
- Gravestone Doji: A Gravestone Doji presents with a narrow closing range near the low, following strong upward movement during the same period. The sharp retreat suggests that initial bullish intent was overruled by late selling interest.
- Shooting Star: The Shooting Star also shows a long upper wick with a small body near the session low. It highlights a failed attempt to push higher, followed by selling pressure.
Bottomline
The bearish spinning top captures the ambiguity. What follows this formation often holds more meaning than the candle itself. When placed beside tools such as volume metrics or resistance mapping, its role becomes more focused.
FAQs
It reflects uncertainty in price movement. Buyers and sellers both participate but fail to take control. What comes before it matters. Its meaning depends on where it forms in the trend. After a rally, some view it as a possible pause or early sign of weakness. In a decline, it might suggest temporary support.
Confirmation often comes from what follows, not the candle itself. Some watch for volume to increase after the pattern appears. Others check if price reacts near a moving average. RSI may show divergence when momentum weakens. MACD sometimes signals a shift through a crossover. Each tool offers a different lens.
Its value depends on where it forms and what comes next. Alone, it reflects hesitation. Some use it as an early sign of fading strength. Without follow-through, it may lead nowhere. Context gives it meaning. Tools like volume or trend indicators often help refine its relevance.
They look similar at first glance. Both have long shadows and a small real body. The difference lies in how close the open and close are. A doji has almost no body at all. The spinning top shows a bit more separation. Each suggests indecision, but in slightly different ways.
Its counterpart appears during a decline, not a rally. The shape stays the same. What changes is the placement. Some refer to it as a bullish spinning top. It reflects hesitation when sellers begin to lose strength.
Yes, it can appear on shorter timeframes. Some intraday traders observe it during quick market shifts. On its own, it may not provide enough information. Smaller charts can produce more false signals. Additional tools or confirmation candles are often used to support the analysis. Market context remains important.
A bullish spinning top appears after a downtrend and indicates that selling pressure is weakening while buyers are starting to step in. It shows market indecision but can signal a potential upward reversal if confirmed by a strong bullish candle.
A bearish spinning top appears after an uptrend and suggests that buying momentum is slowing down. If followed by a bearish candle, it may indicate a possible downward reversal.
A spinning top is generally considered a neutral candlestick because it represents indecision between buyers and sellers. Its bullish or bearish implication depends on the overall trend and the confirmation from the next candle.