India’s stock market moves fast, and for most traders, reacting to every price change only adds stress and confusion. Many enter trades without a clear plan, exit too early out of fear, or hold too long, hoping for a reversal. This is where swing trading stands apart. It focuses on catching meaningful price moves that unfold over a few days instead of chasing every candle. With the right approach, swing trading brings structure, patience, and clarity into an otherwise noisy market.
This blog breaks down swing trading strategies in a practical, easy-to-follow way.
Best Swing Trading Strategies
Swing trading involves holding a position from a few days to several weeks to capture the profits from short to medium-term price movements. It lies in a sweet spot between the fast-moving intraday and slow-paced investing.
The goal is not to predict every move but to participate in the most probable part of a price swing with controlled risk.
Moving Average (MA) Crossover Strategy
When a faster average begins to edge above a slower one, it often reflects a quiet shift in buying interest. If that relationship flips, with the faster line slipping back underneath, it usually points to weakening momentum and sellers starting to regain influence.
For the moving average strategy in swing trading, 50-day, 100-day and 200-day MAs are commonly used. What matters more than the exact numbers is how the price behaves around them.
A good approach when using this strategy is to wait for a minor pullback after the crossover and then enter after the price starts following the new signals. It reduces false signals and minimises the risk.
RSI + MACD Strategy
The RSI MACD strategy is simple to implement because they balance each other well. While one tracks how quickly price is moving, the other looks beneath that movement to see if strength is still present. Used side by side, they encourage traders to read market behaviour more carefully instead of reacting to price on impulse.
RSI gives a quick sense of whether the price is pushing strongly or taking a pause, without needing to predict reversals. MACD supports this view by showing how momentum is behaving beneath the surface and whether the current direction is being maintained.
In swing trading, this combination is mainly used to support a trade idea rather than create one. For example, during an uptrend, stable RSI readings along with a supportive MACD often indicate that a pullback is part of the trend, not the end of it.
This setup works best when trades move with the broader market direction. Using it against the trend usually leads to mixed and unreliable outcomes.
Breakout & Retest Strategy
Breakouts hint at a shift in control. Price moves beyond a level where selling previously slowed it down, showing that buyers are now willing to step in and push prices higher. At first glance, the breakout trading strategy can feel encouraging and draw quick attention.
Price doesn’t always behave neatly. Many breakouts lose momentum and drift back, which can quickly put early positions under stress. This is where a retest becomes useful. Instead of reacting straight away, traders let price return to the breakout area and observe its response. If that zone holds and price starts to stabilise, the move carries more weight.
This style of trading calls for restraint. Waiting through a retest can feel uncomfortable when the market is active, but it often sharpens judgment. Retest entries offer a healthier balance between risk and reward than trades taken in a hurry.
Fibonacci Retracement Strategy
The Fibonacci retracement strategy often sounds more technical than it actually is. They point out areas where price commonly hesitates or reacts while pulling back.
These levels work best after a clear and strong move. Markets don’t move endlessly in one direction. After a sharp push higher or lower, the price usually slows down, retraces a portion of the move, and then reassesses its next step. Fibonacci simply helps organise that pause and makes it easier to focus on where price might respond next.
Levels like 38.2%, 50%, and 61.8% matter mainly because many traders watch them. When price reaches these areas, and they also line up with old support, a trendline, or a moving average, they often stand out even more.
In an uptrend, a gentle pullback into one of these zones with no heavy selling can be a healthy sign. If price holds up and starts making higher lows again, it often suggests the trend is still alive.
When the market has no clear direction, Fibonacci doesn’t add much value. Without context, the levels are just lines on a chart.
Trendline Pullback Strategy
Trendlines help simplify price movement by revealing the direction the market is respecting. A trendline trading strategy offers a clear structure that traders can work around rather than guessing entries.
During strong trends, price rarely moves in a straight line. Pullbacks toward the trendline often signal temporary pauses instead of weakness. For swing traders, these moments can present controlled entry zones rather than reasons to exit early.
Not all trendlines deserve attention. Lines that price has interacted with repeatedly tend to carry meaning, while randomly drawn ones add little value. When price drifts back toward a respected line with fading momentum, it often suggests the pullback is losing strength.
Extra confirmation helps refine timing. A supportive candlestick, a steady RSI reading, or repeated failures to break the line can all add confidence. Risk stays defined by placing stops just beyond the structure, allowing discipline to guide the trade instead of emotion.
Price Action Candlestick Strategy
Price action strips things back to the basics. Instead of searching for confirmation from indicators, it asks one simple question: how is the price behaving right now? That shift in focus often makes market movement easier to understand.
Candlestick patterns help translate that behaviour. A pin bar might show rejection, an engulfing candle can reflect sudden dominance, while an inside bar often signals hesitation. These patterns don’t shout predictions, but they quietly reveal changes in control as a session unfolds.
In this strategy, where a pattern forms matters more than the pattern itself. Signals appearing near support, resistance, or during a pullback in a trend carry far more meaning than those forming randomly.
Learning price action is not about memorising candle names. It develops through observation and context, helping traders ignore weak signals and act only when price behaviour makes sense.
Best Time Frame for Swing Trading
The swing trading time frames are used to understand the price movement and then set the entry, stop-loss and targets. Most swing traders rely on multiple time frames rather than a single chart to get a better overview of the trend.
4-Hour Charts: The 4-hour chart is used to determine the entry and exit points. This timeframe filters out the noise from the hourly charts and is still fast enough for taking refined positions, which makes it useful during volatile markets.
Daily Charts: The daily charts are the most commonly used charts by beginners as well as experienced traders. The biggest benefit is that it eliminates the need to constantly check the charts. The daily charts are useful for identifying the trade setups.
Weekly Charts: This chart is useful for understanding the market direction. Support and resistance levels are clear in weekly charts. It helps avoid trading against the market direction and guides your trading plan.
Best Indicators for Swing Trading
Indicators are useful tools that enhance decision-making in swing trading. Using these indicators for swing trading blindly might create confusion, so it is important to put some thought into it when applying them.
MAs help define direction. They smooth out price movement and make trends easier to spot. When the price stays above a rising average, it usually reflects underlying strength. In swing trading, moving averages also act as dynamic support or resistance during pullbacks.
RSI focuses on momentum. It shows whether a stock is pushing too hard in one direction or simply pausing within a trend. Instead of using it to predict reversals, many traders rely on RSI to confirm whether momentum still supports the trade.
Fibonacci Retracement highlights areas where price often reacts during corrections. These levels don’t guarantee reversals, but they help narrow down zones of interest.
MACD tracks shifts in trend and momentum together. It is especially helpful for spotting early changes in direction or confirming continuation after a pullback.
Volume adds context to every move. Strong price action backed by volume carries more weight than movement that happens quietly.
Swing Trading Example (Chart Breakdown)
To understand how swing trading works in practice, consider a hypothetical setup based on Reliance Industries’ price behaviour during March 2024. This example is used purely to illustrate how traders combine time frames and structure their decisions.

The daily chart of Reliance Industries (NSE) sets the context for this swing trade.
- Earlier in the month, the stock corrected sharply and then began holding near the ₹1,420 – ₹1,430 zone. Despite short-term weakness, price did not break below this area, indicating potential demand at lower levels.
- On 18 March, the daily candle closed higher with improved volume. This move suggested that selling pressure was easing. While not an entry signal, it hinted that price was attempting to stabilise rather than continue lower.
- At this point, a trader would use the daily chart only to assess direction and risk, not to enter the trade.
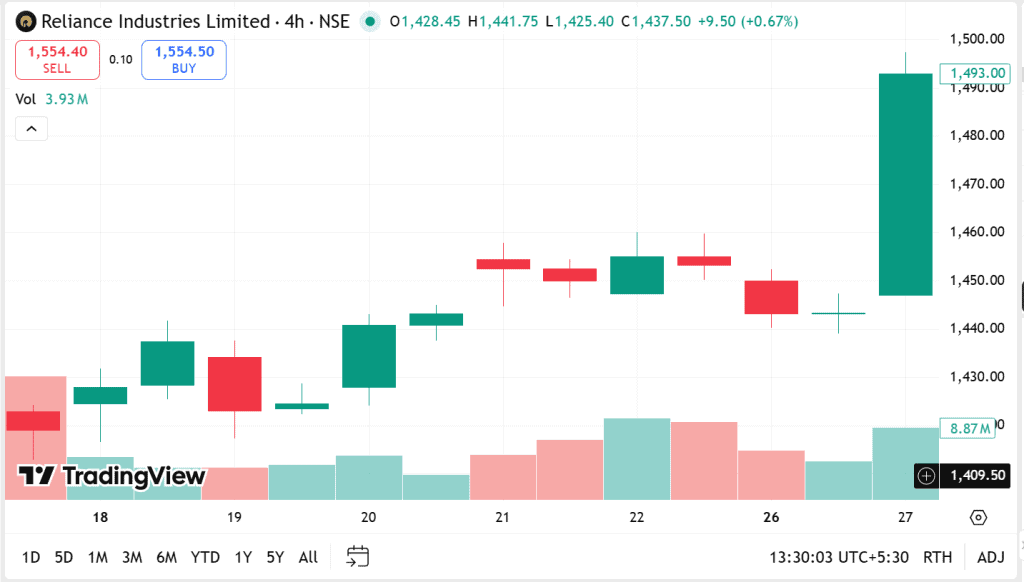
The focus then shifts to the 4-hour chart for execution.
- Between 18 March and 21 March, price moved sideways with smaller candles and declining volume, showing that sellers were gradually losing control while the support zone remained intact.
- On 22 March, a bullish candle formed on the 4-hour chart and closed near the session high. This candle could be treated as confirmation that buyers were stepping in.
- A trader might consider an entry above this candle, with a stop-loss placed below the recent swing low to keep risk defined.
- Over the next few sessions, price moved higher and reached the ₹1,490–₹1,500 zone by 27 March, allowing the swing to play out in line with the higher-time-frame structure.
The move remained controlled, respected support levels, and unfolded without sharp reversals – illustrating how swing trades often develop when structure and patience align.
Position Sizing & Risk Management Rules
Staying in the market long enough to improve has very little to do with finding the perfect setup. It has everything to do with how losses are handled. Without risk management in trading, even a single trade can snowball into a big disaster.
Many traders follow a simple boundary to protect their capital: they keep the risk on each trade small enough that one mistake doesn’t matter. Keeping the position size 1-2% of your total capital is considered ideal, but the exact percentage matters less than the discipline behind it.
Position sizing should come from logic – how far the price can move before the idea fails – not from confidence, excitement, or fear of missing out. Keeping the position size 1-2% of your total capital is considered ideal.
Stop losses work best when they have meaning. They should sit at a level that clearly proves the trade wrong. Placing them randomly or adjusting them emotionally often leads to repeated small losses that quietly add up.
Profit planning requires restraint. Swing trading isn’t about capturing every point of a move. Executing a well-planned trait becomes the decisive factor.
Common Mistakes to Avoid
Many swing trading mistakes come from habits that seem small but slowly hurt results over time.
1. Overtrading
Markets move every day, but quality setups do not. Taking trades out of boredom or impatience usually leads to weak entries and unnecessary losses. Swing trading rewards selectivity, not constant activity. Waiting for alignment is part of the job.
2. Strategy Jumping
A losing trade can trigger doubt, especially for newer traders. The problem begins when strategies are abandoned before enough data is collected. No setup works all the time. Real performance only becomes visible after a meaningful sample size.
3. Ignoring Timeframes
Trading without checking higher time frames is like driving while only watching the speedometer. Daily or weekly levels often decide whether a trade succeeds or fails. Skipping this step leads to trades that stall or reverse unexpectedly.
4. Emotional Risk Taking
Losses can create pressure to recover quickly. Increasing position size or loosening stop-loss rules during these moments usually makes the situation worse. Risk should be calculated, not adjusted based on frustration or hope.
5. No Trading Plan
Entering trades without clear rules for entry, exit, or risk usually leads to uneven results. When structure is missing, emotions quietly take charge. A written plan brings focus and direction, helping decisions stay consistent even when markets feel uncertain.
Conclusion
Swing trading is about making thoughtful choices, not forcing activity. Some days are best left untouched, while other days need just one solid decision. Discipline keeps actions grounded when conditions feel unclear. Real progress comes from staying true to your rules, keeping trading steady rather than mentally draining.
FAQ‘s
There is no particular best strategy for swing trading. It depends on your risk tolerance, time horizon and trading goals. Some traders prefer trend-following methods, while others focus on moving averages, price action or Fibonacci retracement.
Swing trading can be profitable for beginners if they focus on learning gradually, managing risk properly, and avoiding overtrading. Starting with simple strategies helps build consistency.
There isn’t any universally best timeframe, but the daily and 4-hour charts are most commonly used for swing trading as they offer clarity without requiring constant screen time.
A swing trade can last from a few days to several weeks, depending on market conditions and price movement.
The popular swing trading indicators include moving averages, RSI, MACD, Fibonacci retracement, and volume, which help confirm trends and momentum.