Ever noticed price moving in a tight, almost sleepy range, and then suddenly, it bursts out with fresh energy? That’s classic Bollinger Band Squeeze behaviour.
Understanding this pattern helps you spot big moves before they happen, instead of always catching up late. In this article, let’s break down what a Bollinger Band Squeeze is, how it sets up breakouts, and the best ways to use it for your trading.
What is a Bollinger Band Squeeze?
A Bollinger Band Squeeze is a situation on a stock chart where the two Bollinger Bands contracts close, reflecting low volatility. It often means that the market’s gone quiet, traders are hesitating, and there’s very little price movement. The squeeze isn’t just some random pattern; it is a powerful setup used in technical analysis to spot potential breakouts.
Think of it as a spring being pressed; you know it is going to snap, but you don’t know which direction it will go. Once the price finally moves, that’s when the fun begins.
What is a Bollinger Band Squeeze Breakout?
The real action starts when price escapes from that tight band range. This move is called a Bollinger Band Squeeze Breakout.
In breakout trading, this moment is key; it often signals the start of a brand new trend. Sometimes the breakout runs up, other times it fizzles or reverses. What counts is not rushing in right away when the bands are close, but waiting for a confirmed breakout.
How Does the Bollinger Band Squeeze Work?
Bollinger Bands are drawn around a moving average on your stock chart.
There’s one band above and one below, usually set two standard deviations (or basically two “steps”) away from the middle line. When the bands stay wide, volatility is high, and the market is moving. When the bands come together, price action shrinks and volatility drops.
Most big moves in the market start when volatility is low and about to rise. A squeeze literally shows you when traders are waiting and when pressure is building. Once enough traders pile in, that energy snaps, and price moves sharply out of its narrow range.
How to Identify a Bollinger Band Squeeze Breakout
Spotting a squeeze breakout is about watching for a few signs:
- The bands on your chart get close, tighter than usual.
- Price moves sideways, forming small candles or low swings.
- Wait for a strong green or red candle that breaks above or below the bands.
- Volume rises fast with the breakout. That’s your most important clue: more participation means a real move.
Experienced traders also look at the “BandWidth” indicator. If it’s at a monthly low, that’s often a sign that the price is snoozing and might wake up soon.
Bollinger Band Squeeze Breakout Strategy
Traders use this pattern to catch early moves, but discipline is key.
Entry Signals
- For a bullish move, buy when the price closes above the upper band, with a strong candle and rising volume.
- For a bearish move, enter short when price closes below the lower band, again with momentum behind the move.
- Ignore breakouts if volume isn’t picking up. Weak volume is a sign that traders aren’t convinced.
Stop Loss and Exit Points
- Always set a stop loss. For long trades, keep it just below the lower band. For shorts, it goes just above the upper band.
- You can establish a target by measuring how far the band moved during the squeeze, or you can follow your stop if the move keeps going.
- Remember that not every breakout is a success; therefore, protect your interests.
Confirming with Volume
- Volume is your best friend during a squeeze. A true breakout is almost always confirmed by a big jump in traded volume.
- If the price pops out but volume barely moves, hold back. That move might be a fake-out.
Best Indicators to Use with Bollinger Band Squeeze
It helps to combine this pattern with other signals.
Bollinger Bands with RSI
Check the momentum with the Relative Strength Index (RSI). A breakout above the upper band is even better if the RSI moves above 50 at the same time.
Bollinger Bands with MACD
The MACD (Moving Average Convergence Divergence) is great for trend shifts. Look for a bullish MACD crossover as the price breaks out upwards from the squeeze. For shorts, a bearish MACD signal adds confidence.
Examples of Bollinger Band Squeeze Breakouts
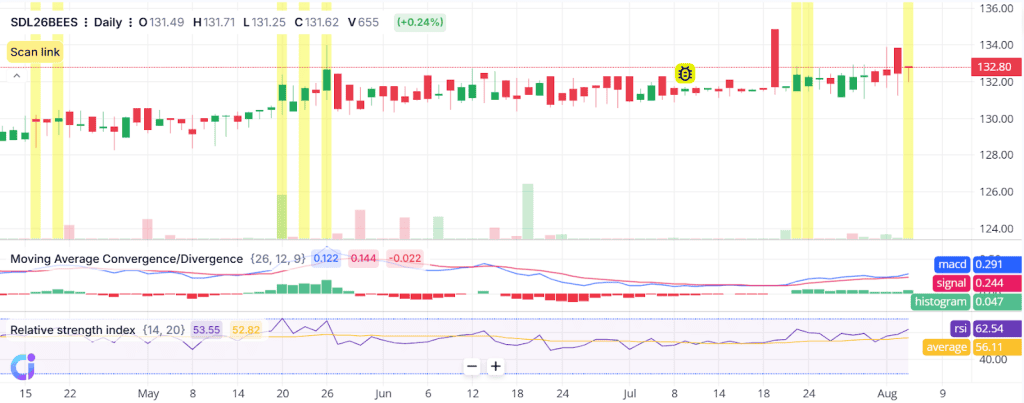
A perfect example of a Bollinger Band Squeeze Breakout is visible on the daily chart from mid-June to early August. During June and July, price action is confined within a very narrow range, the candles are small, and volatility is extremely low. This is the classic Bollinger Band squeeze phase, where the upper and lower bands come close together, signalling that the market is taking a breather and waiting for something to happen.
As August begins, the quiet is broken when a strong bullish candle closes convincingly above the tight range, indicating a breakout. This breakout candle would close above the upper Bollinger Band, confirming a surge in momentum. The clear rise in trading volume on that day, which shows that a lot of people are involved in the market and believe in the upward trend, makes this move stronger.
The Relative Strength Index (RSI) goes over 62, and the MACD line turns positive, both of which show that bullish momentum is getting stronger.
After this breakout, the price stays on an upward trend for a few days, giving traders the chance to take advantage of the momentum-driven advance that started after the squeeze ended. This chart shows how the Bollinger Band Squeeze Breakout can help you predict big price changes by waiting for obvious signs instead of guessing.
Advantages and Limitations of Bollinger Band Squeeze Breakout
| Advantages | Limitations |
| Alerts you to big moves before they start, unlike lagging indicators. | Doesn’t tell you the direction in advance; you must wait for confirmation. |
| Clear, visual signal, no need for guesswork. | There might be false breakouts, especially if the move isn’t backed up by volume. |
| Can be used with intraday, daily, or even weekly charts. | Works best when there isn’t much volatility, not when there are strong, persistent trends. |
| Helps you plan solid entries and exits. | Sometimes price fakes out in one direction and instantly reverses. Using stops is necessary. |
Conclusion
A Bollinger Band Squeeze tells you when the market is tightly wound up and ready to move. If you wait for a breakout, you can miss out on early trends. Check the volume and use indicators like RSI or MACD to confirm. Not every squeeze will cause a huge move, but when it does, you’ll be ready to see it and take advantage of it.
For the best results, practise locating these settings and using good risk management at the same time.
FAQs
The Bollinger Band Squeeze breakout technique looks for price movement at a time when the bands get tighter and the market is less volatile. Once price breaks out of the band with strong momentum, traders enter the breakout’s direction, aiming for quick profits.
Volume, RSI, and MACD are the best signs that a Bollinger Band squeeze breakout is happening. Rising volume shows strength behind the move. RSI can offer signs that a stock is overbought or oversold. MACD helps spot momentum shifts that support the breakout.
First, find a squeeze where the bands are close together. Wait for a clear breakout with volume. If price breaks above the upper band, go long. If it breaks below the lower band, go short. Use stop-loss and confirm with other indicators.
Yes, the Bollinger Band squeeze breakout might be a good way to trade during the day. Quick squeezes happen a lot in short time frames. Traders can ride the short-term move for small but quick gains after the price breaks out, as long as they employ volume and trend confirmation to be safe.
It all depends on how you want to accomplish things. People like to trade during the day with charts that show five and fifteen minutes. 1-hour and daily charts are good for swing or positional trading. Whatever the timing, just make sure the squeeze is evident and the volume backs up the breakout.