
What is the Bullish Abandoned Baby candlestick pattern?
Bullish abandoned baby is a triple candlestick pattern that indicates traders that the downtrend is over and indicates a potential trend reversal in the market. It hints that selling pressure might be cooling off. If this pattern appears, traders often take it as an early sign that buyers are stepping back in and the trend could turn bullish.
But to understand what the Bullish Abandoned Baby candlestick pattern looks like, let’s get into the details right away.
How is a bullish abandoned baby candlestick formed?
Here’s how the pattern looks:
- Candle 1: The Sell-Off
It’s a solid bearish candle showing strong selling pressure.
- Candle 2: Doji with Gap Down
It opens lower and forms a gap from the first candle’s close. There will be no overlap of body or wick of the candle with the previous or next candle.
- Candle 3: Strong Green Candle with Gap Up
It opens above Doji and closes higher.
What does green bullish abandoned baby candlestick tell?
When the market shows sustained declines in prices, a bullish abandoned baby pattern could be seen. Here’s what the pattern signifies:
- A large bearish or red candle shows strong selling pressure.
- A Doji candle below the first tells about the indecision and forms a gap with no overlap.
- The third large green candle with a gap up from the Doji shows that buyers have decisively taken control.
Example of bullish abandoned baby
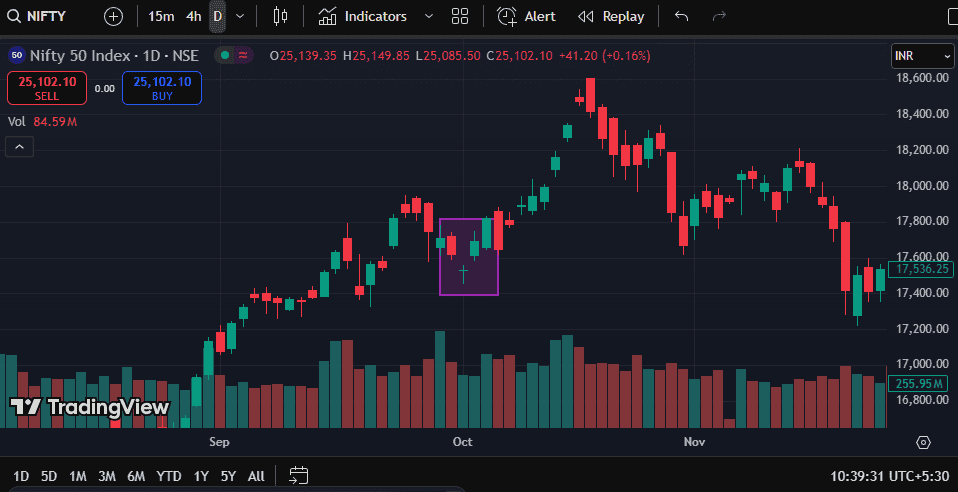
In this chart of Nifty 50 Index with a time of a day, the first candle opened at 17,742.15 and closed at 17,585.35 on 30 Sep 2021. On 1 Oct 2021, a Doji appeared with its opening price at 17,452.90 and closed at 17,557.15. This showed indecision among the investors.
A big green candle appeared on 4 Oct 2021 which opened with a gap up at 17,581.35 and closed at 17,750.90. This confirmed a bullish trend in the Indian stock market and it made a high till 19 Oct 2021.
When does bullish abandoned baby candlestick happen?
- During High Volatility Sessions
More likely in stocks or forex markets with frequent overnight gaps.
- After Seller Exhaustion
Forms when bears lose momentum, and market pauses with a Doji.
- Gap Conditions Must Be Met
Doji must be present below the red candle and a gap should be present.
- At the Bottom of a Downtrend
Appears after sustained selling pressure, signaling possible trend reversal.
How to read bullish abandoned baby candlestick in technical analysis?
1. Pattern structure
Day 1: Long bearish candle
Day 2: Doji gapped down, no overlap with Day 1 or 3
Day 3: Long bullish candle gapped up
2. Implications
It signals strong potential for bullish reversal. The pattern is used for technical analysis of the shift in market sentiment. The double gap in the Abandoned Baby Pattern isolates the Doji.
How to trade the bullish abandoned baby pattern
- Get the entry at the close or breakout of the last bullish candle.
- Use a stop loss below the lower point of the Doji candle.
- Use resistance zones, moving averages, or previous highs.
- Add volume confirmation or trendline breaks to reduce false signals.
Where is the bullish abandoned baby commonly used?
- Markets: Stocks, Forex, Futures and anywhere with gaps.
- Timeframes: Daily or higher that are rarely reliable on intraday charts.
- Conditions: It is only valid after a downtrend.
How reliable is the bullish abandoned baby?
- Higher timeframes like daily or weekly improve reliability.
- High volume during the third candle strengthens the signal and low volume increases the risk of failure.
- The bullish abandoned baby pattern works best with technical indicators such as moving averages, RSI, and support zones.
What are the advantages of the bullish abandoned candlestick pattern?
- Easy to spot due to the different three-candle formation with price gaps on both sides of a Doji.
- Helps traders enter early in a potential trend reversal, especially when confirmed with volume.
- Traders can place precise stop-loss below the Doji.
What are the disadvantages of bullish abandoned baby candlestick?
- Appears infrequently due to strict gap criteria.
- Could rarely be found in crypto and forex markets as true gaps are uncommon.
- Underperforms in sideways or low-volatility markets.
Limitations of bullish abandoned baby candlestick pattern
- It requires clear gaps on both sides of the Doji.
- This pattern needs validation from indicators or price action to improve accuracy.
- Traders cannot always use it in lower timeframes.
What is the difference between a bullish abandoned baby and bearish abandoned baby?
1. Bullish abandoned baby
- Appears after a downtrend.
- Signals bullish reversal.
- The first candle would be a large red, the second is the doji that opens below with a gap, and the third one is the green candle with a gap up.
- Shows buyers taking control.
2. Bearish abandoned baby
- Bearish abandoned baby Appears after an uptrend.
- Signals bearish reversal.
- The first candle would be a large green, the second is the doji that opens above with a gap, and the third one is the red candle with a gap up.
- Shows sellers taking control.
Difference: Bullish abandoned baby vs. morning star
Key differences:
- The middle candle in Abandoned Baby must be a Doji with clear gaps on both sides.
- Morning Star allows small real-body candles in the middle and gaps are optional.
- Shadows in Morning Star can touch while in Abandoned Baby they cannot.
Can I backtest the bullish abandoned baby pattern?
Yes, traders can use platforms like TradingView, MetaTrader, or Python with backtesting libraries. Backtesting helps traders measure pattern success across different stocks, timeframes, and market types.
Common mistakes to avoid
- Traders may confuse the Bullish Abandoned Baby with other reversal patterns.
- False signals may appear if entering short before the third bearish candle.
- Applying this pattern in sideways or consolidating markets reduces accuracy.
Conclusion
The Abandoned Baby for a bullish pattern is a confirmation of a reversal signal towards bullish momentum. While its strict structure limits occurrences, it is highly used by the traders during the volatile market.
FAQs
You can trade this pattern, but only after confirmation from volume and the third bullish candle’s close. It works for the traders who want risk management, stop-loss placement below the Doji, and use technical indicators to reduce false signals.
There are two types: Bullish Abandoned Baby and Bearish Abandoned Baby. The bullish pattern appears after a downtrend and bearish one appears after an uptrend and signals a bearish reversal.
The Bullish Abandoned Baby pattern is for higher timeframes like daily or weekly charts. These timeframes show gap formations. Intraday charts lack these true gaps and reduce the accuracy of this pattern.
A clear downtrend should be there before the Bullish Abandoned Baby pattern. It forms after there is a lot of selling pressure, seller exhaustion, and high volatility.