Most traders react late, entering the trade only after the reversal becomes widely known. However, the Bullish Harami can help them in identifying a momentum shift even before the technical indicators can signal it. This was evident when the Nifty 50 suddenly reversed in September 2023. The analysts spotted a clear Bullish Harami formation, indicating that selling pressure might be fading even before indicators flipped.
To understand how you can make use of this early signal, walk through this guide to learn the Bullish Harami pattern – what it looks like, how to identify it correctly, how to trade it, how it differs from similar patterns, and real-life examples.
What is the Bullish Harami Candle?
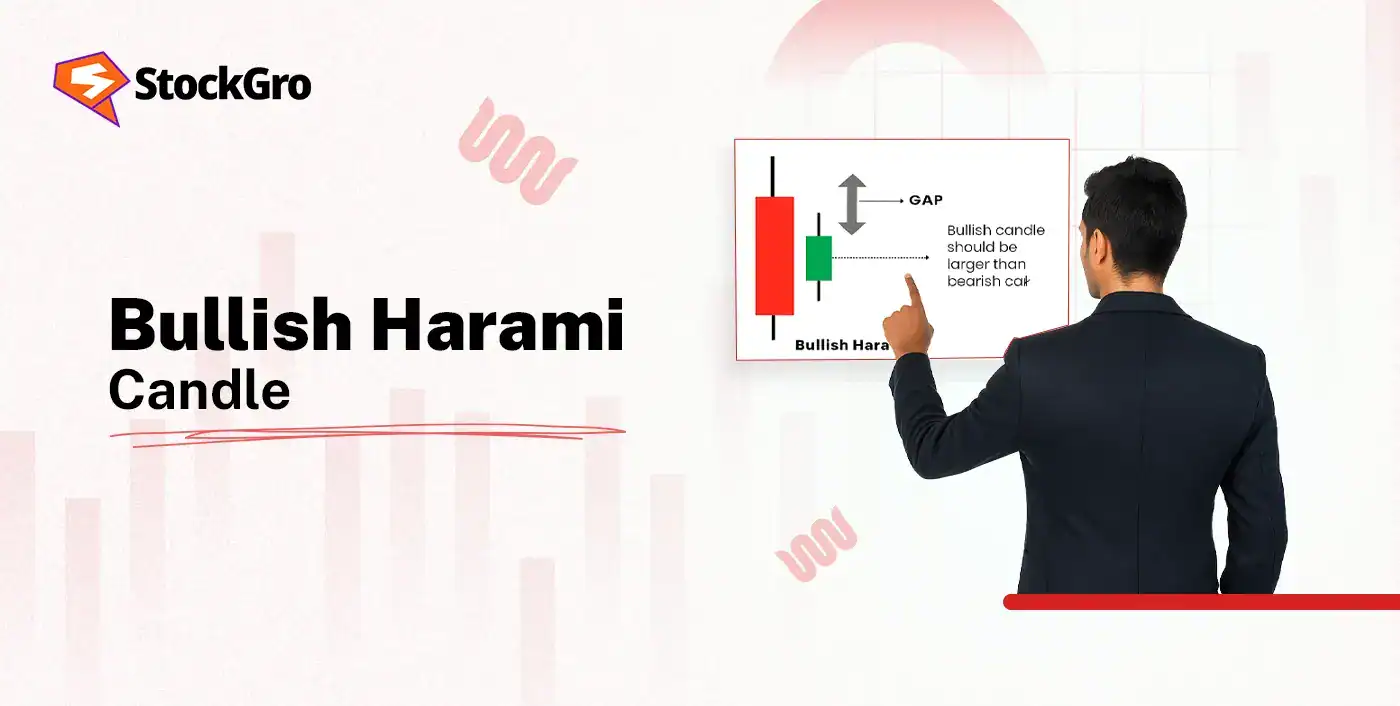
The Bullish Harami is a two-candlestick pattern that indicates a shift from bearish to bullish momentum. It does not represent a guaranteed reversal but shows possible signs of early bullish momentum.
In Japanese, the term “Harami” means pregnant. The bigger bearish acts like the mother, giving birth to the smaller bullish candle (the baby) inside it. The metaphor used to describe the formation of the pattern on a chart.
A bullish harami pattern consists of:
First Candle (Mother): It is long and bearish, reflecting the active participation from sellers.
Second Candle (Baby): A smaller bullish candle that fits inside the first candle’s body.
How to identify Bullish Harami
Identifying this pattern correctly is important as many traders misinterpret the charts and end up making wrong decisions. To identify this pattern, look for:
Structure & appearance of a Bullish Harami
The structure of a bullish harami includes:
- A previous downward trend
- First candle, which is long and bearish
- Second candle, which is small, bullish and completely inside the big candle
Time-frames
The Bullish Harami pattern can form in a variety of time periods given below:
Intraday
It works for active traders, but the intraday volatility can weaken the signal. The rapid pierce changes can distort the candlesticks and may give inaccurate results.
Daily
Each candle represents a full trading session that filters out any fluctuations from the intraday charts. The patterns are clearer, which makes it reliable.
Weekly
A bullish harami formed here is useful in spotting the trend shifts as each candle is used to show an entire week of trading sessions. A weekly Bullish Harami often is a sign of a correction ending and the start of a new upward move.
Takeaway: Use the higher timeframes to establish the main trend and support zones. Then, use the lower timeframes to establish entry and exit positions. In this manner, you can use this pattern across different timeframes.
Confirmation signals
The Bullish Harami pattern gains more strength when it is supported by additional signals that confirm the genuine shift in momentum. These signals are:
Volume
Rising volume in the second candle signals stronger buyer interest and increases the reliability of the pattern. However, low volume shows weak conviction, meaning the pattern may fail or work for a short-term.
Support Zone
Support zones act as the price floors, halting the decline of a stock price. If the pattern is formed near a support zone, it is a potential buying signal. The probability of reversal is increased as this level has previously attracted buyers.
Relative Strength Indicator (RSI)
The RSI is used to assess the size and speed of change in a stock price. An RSI score of under 30 indicates that the stock has been oversold, which is ideal for the Bullish Harami pattern.
The Moving Average Convergence Divergence (MACD)
The MACD evaluates the relationship of two different moving averages of a stock price to give us confirmation of the trend. A bullish crossover in the MACD shows that the momentum is shifting in favour of buyers and the chances of reversal are higher.
Bullish Harami vs other patterns
When we compare the bullish harami with other patterns, we come across the following differences:
Bullish Harami vs Bearish Harami
| Feature | Bullish Harami | Bearish Harami |
| Formation | Forms after a downward trend, signaling the fall in selling pressure | Forms after an uptrend, indicating buyers may be losing strength |
| Candle 1 | Large bearish candle (red) | Large bullish candle (green) |
| Candle 2 | A small bullish candle that fits within Candle 1 | Small bearish candle contained within Candle 1 |
| Traders | Buyers start absorbing selling pressure and slowing the fall | Sellers begin absorbing buying momentum and stopping the rise |
Bullish Harami vs Bullish Engulfing
| Feature | Bullish Harami | Bullish Engulfing |
| Candle Structure | Candle 2 forms inside Candle 1 | Candle 2 fully swallows Candle 1 |
| Signal Strength | Indicates a subtle, early-stage reversal | Shows a strong and aggressive reversal |
| Frequency | More common; appears often in corrective moves | Less frequent; appears during major sentiment shifts |
| Momentum Shift | Suggests reduced selling pressure but not full bullish control | Shows complete takeover by buyers in one session |
| Ideal Use-Case | Works best for early entries before a confirmation breakout | Best for confirmation-based entries with strong volume |
Harami Cross Variant
If the second candle is a Doji, the pattern formed is known as the Harami Cross variation. Doji means the opening and closing prices are identical to each other. It shows the market indecision has reached its peak, and signals an even stronger reversal than the standard Harami pattern.
How to trade the Bullish Harami pattern
If you want to trade using the Bullish Harami, you need to have patience and discipline. A helpful practical strategy is given below:
Entry Rules
Enter on the breakout of Candle 2’s high
Entering on the breakout of the second candle’s high is the most common method. To do this:
- Wait for the price to rise above Candle 2’s high.
- Enter a long position when this level is broken.
Enter after confirmation candle closes green
Wait for the third bullish candle, as it gives stronger confirmation of the momentum turning bullish. This reduces false signals and helps you enter after the reversal has gained credibility.
Enter near the support zone
If the pattern forms near the support zone, you can enter with a tight stop-loss which protects your capital while helping you ride the upward trend.
Stop-loss & Target setting
Placing The Stop-Loss:
When using this pattern, you can place the stop-loss at:
Below Candle 1’s low
Placing the stop-loss just below the first candle gives enough breathing space to your trade while minimising the risk.
Below the nearby support zone
If there’s a support level near the price, setting the stop-loss just below it offers extra protection to your trade.
Target Setting:
Near resistance
Setting the target near the resistance level is practical because the price often slows down, or pulls back when it reaches the earlier high points.
50-day/100-day moving averages
The moving averages act as dynamic resistance zones where price often falls back, making them reliable exit points.
Risk management & trade management
You can employ the following risk and trade management strategies when using the Harami patterns:
- Limit the position size per trade
It helps in keeping the loss size manageable and makes sure a single trade doesn’t wipe off your whole capital. - Use trailing stop-loss
Trailing stop-loss helps in locking the profits when the trade moves in your favour, while giving enough space for the momentum to continue. - Scale out at resistance zones
Taking partial profits at resistance levels reduces risk while allowing the remaining position to capture any additional upside. - Avoid trading in a sideways market
Avoid trading in uncertain markets as the reversal patterns are unreliable, creating false signals.
Using volume, RSI, and MACD with Bullish Harami
Volume: A rise in the volume of the second candle indicates strong buyer participation and makes the pattern more reliable.
RSI: An RSI score of under 30 means the selling pressure is weakening, making the pattern more reliable.
MACD: A bullish crossover confirms that the momentum is shifting in favour of buyers, and reduces the uncertainty of early reversals.
The Bullish Harami pattern becomes significantly more reliable when volume, RSI, and MACD align, signalling higher chances of trend reversal.
Real-life examples
Two examples of stocks where the Bullish Harami appeared are listed below:
Reliance Industries Ltd
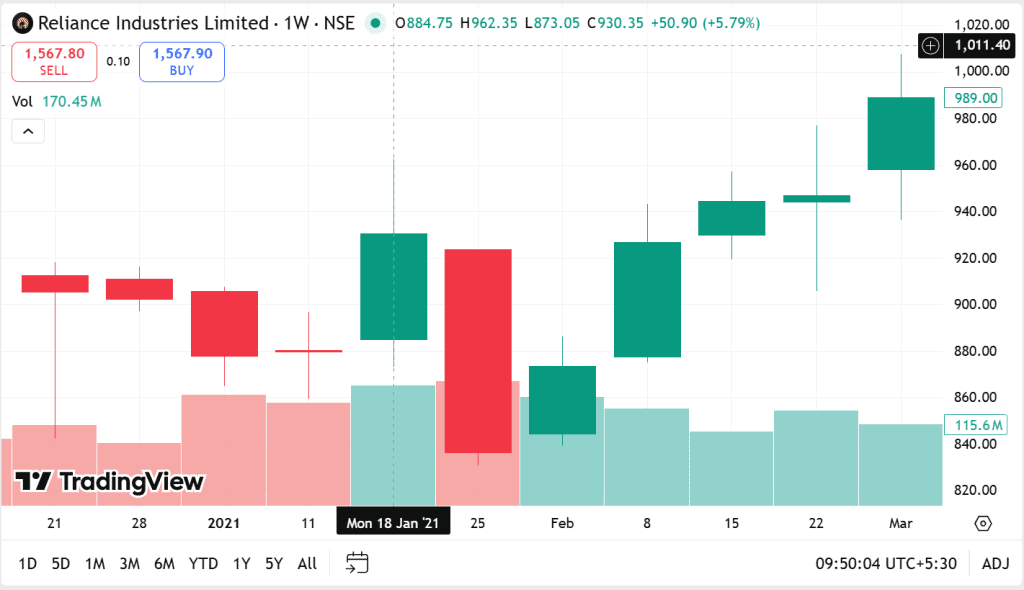
- Reliance Industries formed a Bullish Harami in 2021.
- Candle 2 appeared as a small bullish candle inside Candle 1, reflecting that the sellers were slowing down.
- There was a noticeable rise in Candle 2’s volume, indicating buyers were starting to gain power.
- When the price had a breakout above Candle 2’s high, the stock started recovering, supported by strong crude oil trends and telecom performance by Jio .
- This reversal also aligned with positive market sentiment.
Hindustan Unilever (HUL)
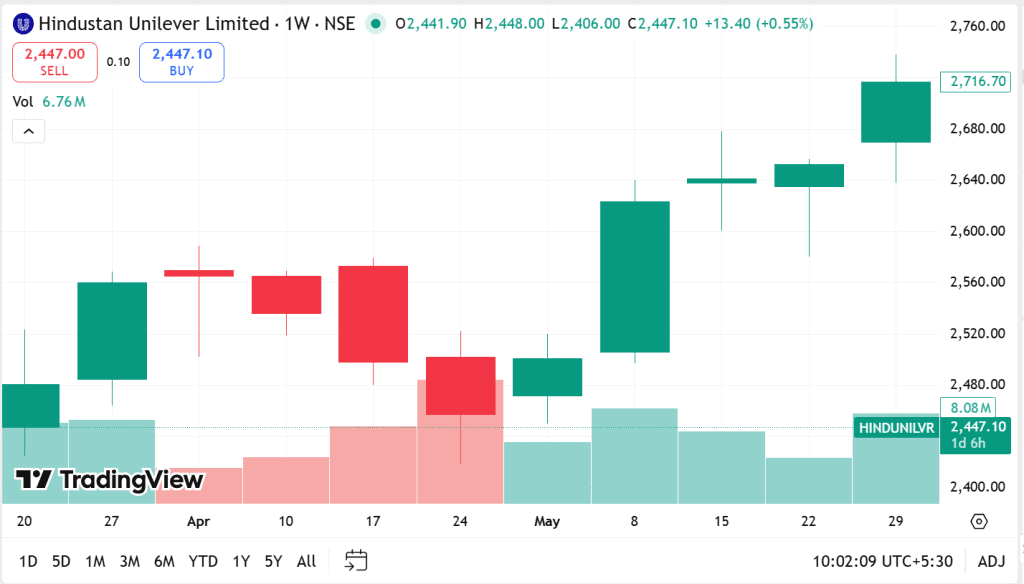
- After falling for multiple weeks, Hindustan Unilever (HUL) formed a Bullish Harami in 2023.
- The second bullish candle formed fully inside the previous large bearish candle, indicating that pressure from sellers had slowed down.
- A rise in volume of Candle 2 indicated buyer interest near the support zone of around ₹2,200.
- After the price broke above Candle 2’s high, the stock moved into a short recovery, backed by increasing rural volumes and stable input costs.
- The market sentiment also improved after FMCG companies reported better-than-expected demand revival.
Mistakes & limitations of the Bullish Harami pattern
Before using the Bullish Harami pattern for trading, you should be aware of its limitations and common mistakes made by traders.
Limitations
- Early reversal signal
It only indicates a potential trend shift, it does not guarantee a reversal.
- Appears frequently
The pattern forms often across different charts, which can lead to misleading signals.
- Requires indicator confirmation
It only becomes reliable with volume, RSI, or MACD support, which validates its genuineness.
Common Mistakes
- Entering without confirmation
Many traders jump in after identifying the pattern. It is better to confirm the pattern with indicators before making a trade.
- Ignoring support levels
Entries taken far away from the support zones lack technical strength and reduce the trade’s accuracy.
- Using it in a sideways market
The pattern fails when used in a sideways market, as it requires a clear trend for signalling the reversal.
- Tight Stop-loss
Setting very tight stop-losses can lead to premature exits. Reversals can have fluctuations and need room to grow.
- Only using candlesticks
Only spotting the candlestick pattern without signals like RSI or MACD increases the chances of false entries.
When it fails
A Bullish Harami fails when it is:
- Formed against the market: The pattern is weak and can not sustain when it appears opposite to the market direction.
- Low volume on Candle 2: Weaker participation from buyers reduces the chances of reversal.
- Sideways market: A market with horizontal movement reduces the pattern reliability as no clear trend can be established.
- No nearby support zone: Without support zones, the reversal does not have a strong base, and the trade loses its accuracy.
- News-driven volatility: Sudden economic shifts or news can disrupt the pattern.
How to reduce false signals
You can use the following methods to reduce the false signals:
- Technical Indicators: Look for an RSI score under 30, a bullish MACD crossover and high volume to confirm the pattern.
- Trade near support zones: Enter trades close to the support levels, which increases the likelihood of successful reversal.
- Volume on Candle 2: A spike in the volume of the second candle reflects buyer interest and adds to the reliability of the pattern.
- Avoid uncertainty: Major economic policies or changes can generate false signals. It is better to avoid trades during such times.
Conclusion
The Bullish Harami is a candlestick pattern that indicates a trend reversal, and potential shift of momentum from a downward trend to an uptrend. It offers valuable insight and gives the best results when combined with support zones, volume and technical indicators like RSI and MACD. Although it is very useful, it still has its limitations.
With proper confirmation, risk management and patience, it can become a powerful tool for identifying potential reversals and making trade decisions.
FAQ‘s
A Bullish Harami is a two-candle reversal pattern where a small bullish candle forms inside a large bearish candle, signalling weakening selling pressure and a potential upward reversal.
Enter when the price breaks above Candle 2’s high, confirm with volume or indicators, and place a stop-loss below Candle 1’s low.
A Bullish Harami has a small candle inside a bigger one, indicating a subtle reversal, while a Bullish Engulfing completely covers the prior candle, showing a strong and aggressive shift in momentum.
The Bullish Harami pattern is moderately reliable, but its effectiveness can be increased by combining it with support zones and RSI/MACD confirmation.
When setting a Bullish Harami, place the stop-loss below Candle 1’s low, and set profit targets at the nearest resistance or key moving averages.
Bullish Harami works for both intraday trading and daily charts, but it gives more accurate results for higher timeframes.
Common mistakes include trading it without confirmation, ignoring support levels, using it in sideways markets, or placing stop-losses too tight.