
A kicker candlestick pattern shows a sudden and clear trend in market direction. This pattern comes in two forms: bullish and bearish, depending on the direction of the price movement.
Both indicate a potential change in sentiment. However, this blog focuses on the bullish kicker candlestick pattern, exploring what it means, how it looks and how traders might use it in different strategies.
What is Bullish Kicker Candlestick Pattern
Bullish kicker is a candlestick pattern that reflects a sharp reversal in market sentiment following a period of downward movement. It represents a point where traders, in large part, turn the earlier direction and respond with renewed upward pressure. This pattern is understood as a sign that bullish momentum might follow, often attracting attention from traders seeking a potential entry point.
How is the Bullish Kicker pattern formed?
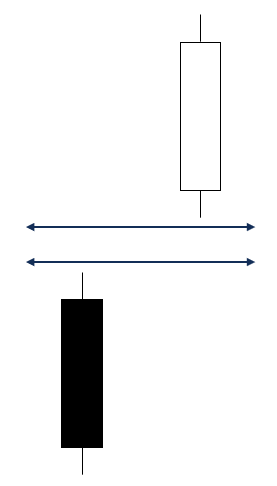
The sequence begins with a negative candle, typically tied to bearish momentum or fading confidence. What follows is a contrasting candle that opens markedly higher. It doesn’t overlap the previous and continues to rise throughout the session. This gap-up indicates a strong buying pressure as it opens well above the previous close.
Does Bullish Kicker Candlestick only form during Downtrend?
Not necessarily. The pattern is primarily observed in the declining phase, it is not limited to such settings. At times, it may appear after a period of sideways trading, where price has shown little direction. In that context, the formation can hint at an emerging move rather than a reversal.
In some scenarios, it surfaces within an existing uptrend following a temporary retracement, suggesting buyers have stepped back in. But it can be insignificant and sometimes can be a false signal.
That said, the pattern tends to carry more weight when seen after a clear decline, as the contrast in behaviour is more defined and strongly confirmed.
How to identify Bullish Kicker?
Spotting this pattern involves closely observing how two candlesticks behave in succession. Hence, look for these elements:
- The first represents a downward move, mostly due to broader market pessimism or selling.
- Next, the market reopens higher, forming a price gap above the previous close/
- The second bar extends upward and finishes near its peak, showing clear buyer dominance.
Example of Bullish Kicker Candlestick Pattern with chart
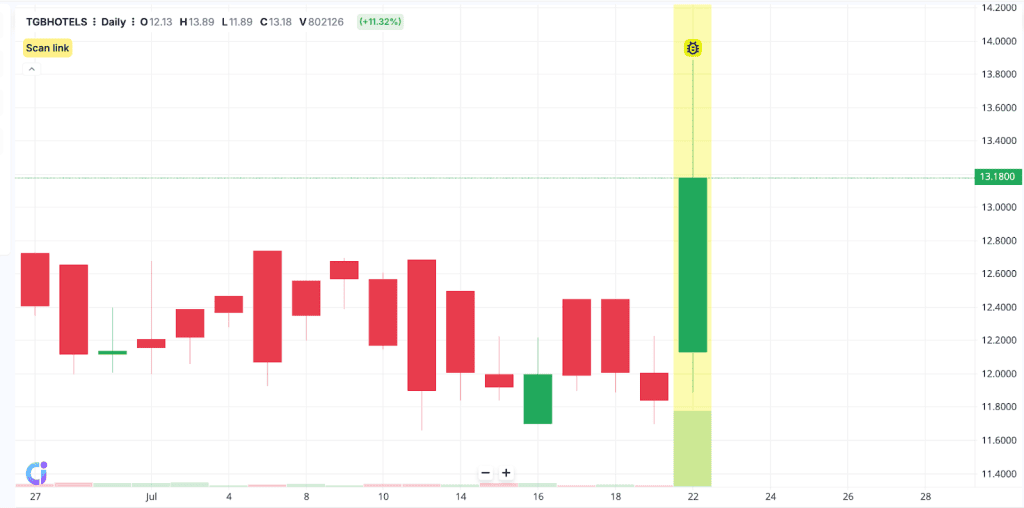
Take TGB Banquets and Hotels Limited on 22 July 2025. The stock rose by 11.32%. One can observe the gap between the previous day’s closing price in red and the next day’s opening in green. This gap, followed by a green candlestick, shows a sudden change in sentiment, and thereby forming a bullish kicker candlestick pattern.
How to use Bullish Kicker Pattern in Technical Analysis?
To use the pattern within technical analysis (TA), involves layered observation. Here are the aspects one must focus on:
- First is the identification of the full pattern clearly, closely noticing the price gap and the direction of both candles
- Supplement the visual reading with tools like Relative Strength Index-RSI or MACD to confirm momentum change and potential reversal
- Observe trading volume on the second candle, as a noticeable rise may reflect broader market participation
- Plan entries around the confirmation candle and place stop-loss orders below the recent low to manage downside risk
- Set a profit target where price previously reversed or slowed, such as a known resistance level or recent high. Or choose a target that offers a balanced return in relation to the risk taken on the trade
What is the success rate of the Bullish Kicker Candlestick Pattern?
Results differ across trading conditions and timeframes. As noted earlier, the bullish kicker may show higher reliability when it appears after a clear downward phase.
In quieter markets or within established trends, its influence can be less consistent. The signal offers perspective when viewed with other technical & fundamental factors. Traders often consider its context before drawing conclusions, as no individual pattern offers guaranteed results.
How reliable is the Bullish Kicker Pattern?
Its reliability often hinges on where it emerges within the broader pattern including market conditions, trading volume and supporting metrics. While often it is seen as a strong signal for uptrend continuation, its reliability may weaken during bearish phases.
How to Increase Bullish Kicker Candlestick Pattern’s Accuracy?
- Assess the pattern’s strength: Evaluate the distance between the candles and the size of each body. Short wicks combined with wide gaps often suggest cleaner intent
- Review trading volume: If the bullish session shows distinctly higher volume than the preceding one, it may reflect greater conviction behind the change
- Factor in volatility: In highly erratic trading periods, similar patterns may form without meaning. Prioritise signals that emerge from more orderly conditions.
How to trade with the Bullish Kicker Pattern?
- Step 1: Confirm the momentum: Look whether supporting indicators like the RSI or MACD conducive with the observed move
- Step 2: Entry point: Enter the trade near the open of the third session or above the bullish candle’s high, depending on how price reacts
- Step 3: Set a stop-loss: Place your risk control slightly beneath the lowest point of the earlier bearish candle to manage any adverse turn
- Step 4: Mark the exit: Frame your target using nearby resistance zone or recent turning zones to avoid vague expectations
- Step 5: Review the setup: Filter the setup by reviewing volume and recent market activity to avoid reacting to isolated signals in erratic conditions
What is the best time frame to trade Bullish Kicker Candlestick?
The choice of time frame depends on how trades are managed and the pace at which decisions are made. Shorter windows may reveal frequent movements but often contain excess market noise. Longer views such as daily or weekly charts can highlight meaningful direction while filtering out temporary moves.
How to use Bullish Kicker Candlestick with Moving Average(MA)?
Moving average shows the average price over a set number of periods and helps identify the overall direction. When a bullish kicker takes shape near or above MA, it may suggest that the upward move is supported by the broader trend. Plus, the price that moves above the MA, can act as a potential entry point.
How to use Bullish Kicker Candlestick together with Relative Strength Index (RSI)?
RSI is an indicator that shows whether the market is overbought or oversold. In general, RSI uses levels like 30 (oversold) & 70 (overbought). Hence, when the RSI is below 30 on the first candle of a bullish kicker, it may signal that the market is oversold before the reversal begins. Therefore, this combination helps to confirm the pattern before entering a trade.
How to use Bullish Kicker with Low ADX-Value?
Average Directional Index is an indicator that shows how strong or weak a trend is. A value below 20 typically means the market has no clear trend. Now, a bullish kicker is a strong reversal signal. When this pattern appears during a low-ADX, it may suggest a beginning new upward trend. And, if the price moves strongly after the kicker & ADX starts to rise, it confirms the uptrend.
Advantages of Bullish Kicker pattern?
- The pattern is made up of only two candlesticks, allowing early recognition
- It highlights a sharp reversal, even in the absence of secondary indicators or supporting tools
- The pattern suits a range of time frames, though more stable results may appear on higher time frames
- Entry and risk levels are usually easy to define, making the pattern suitable for both manual and rule-based strategies
Disadvantages of Bullish Kicker pattern?
- The pattern is rare across broader time settings, which may limit practical use for longer-term strategies
- It often reacts to sudden external events, offering little room for preparation or planned entry
- Without sustained movement after the gap, the signal may lose relevance, especially in less stable conditions
Is Bullish Kicker Candlestick Pattern profitable?
Generally, it can yield favourable results when applied with risk management and supporting indicators like RSI or ADX as discussed above. Its reliability tends to improve when the pattern aligns with strong momentum or follows a period of downfall.
Bullish Kicker vs Bearish Kicker
| Feature | Bullish kicker | Bearish kicker |
| Trend setup | Shows up after a decline | Appears after an increase |
| First candle | Bearish, closing lower | Bullish, closing higher |
| Second candle | Opens above the first, pushes higher with strength | Opens below the first, drops sharply and closes lower |
| Message | Buyers are stepping in with force, possibly flipping the trend | Sellers have taken over, and momentum may be turning down |
| Use case | Spotting early upside reversals or renewed buying interest | Catching shifts before potential downside unfolds |
Bullish vs Bearish Kicker vs Engulfing
| Aspect | Bullish kicker | Bearish kicker | Engulfing pattern |
| Core move | Bearish candle flips into a bullish gap-up with no overlap | Bullish candle gives way to a sharp gap-down bearish follow-through | Second candle fully wraps around the first, reversing the prior move |
| Shift in control | Buyers step in aggressively after a weak session | Sellers take over instantly after earlier buying pressure | Gradual but clear handover between buyers and sellers |
| Gap requirement | Yes, a clear gap between the two candles | Yes, downward gap confirms strength of reversal | No gap needed between sessions |
| When it shows up | Often seen after a strong drop or sentiment shift | Common around market highs or sharp news events | Found at trend extremes or during consolidations |
| How often | Rare but strong when it hits | Infrequent and driven by sudden news or flow | Seen more regularly across charts and timeframes |
Significance of Kicker Candlestick Pattern
The pattern reveals a sudden and clear change in market trend. It generally shows the early stages of a reversal, giving traders a slight chance to react before momentum builds. Because it forms with strong price movement and no overlap between candles, the message is direct. This structure works across timeframes and helps define entry & exit levels with minimal delay or ambiguity.
FAQs
It can appear in both directions. The bullish version forms after a decline and signals buying pressure. The bearish version shows up after strength and suggests a shift to selling. What matters is the position and context. Traders often read it as a sign of sudden sentiment change. Its meaning depends on where and how it forms.
Its strength often depends on timing and context. It shows potential when paired with supporting tools like volume, RSI and moving averages. Without support, it can be misleading. Traders often wait for alignment before acting. Its effectiveness shifts with volatility and market phase.
A clear gap between two opposite candles is a starting point. The second should open away from the first without overlap. Volume adds weight if it expands on the move. Tools like RSI or a nearby moving average can help confirm the shift. Together, these elements offer better clarity than the pattern alone.
Start by checking if momentum supports the move. RSI or MACD can help spot early confirmation. If aligned, look for price action above the bullish candle’s high. Keep a stop-loss just under the previous session’s low. Use nearby resistance to plan an exit. Watch volume and overall market behaviour before acting.
Moving average can help spot trend direction. A price move above it may support bullish continuation. RSI shows whether the asset is oversold or overbought. A reading below 30 before the pattern forms can strengthen the reversal case. ADX helps judge trend strength. A low value before the move may hint at a shift. If ADX rises after the pattern, it could confirm the momentum. Use them together for better context.
Some enter too late, chasing a move that’s already lost steam. Others skip confirming volume, which often leads to false setups. Ignoring broader news or trend context is another slip that can distort what the pattern really signals. Many neglect stop-loss planning or place it too tight. Misreading other gap-based patterns as a kicker also happens often. Hence, it’s not about spotting candles but it should be read with context.