In the ebb and flow of price action, candlestick patterns speak something louder, and one such voice is the bullish marubozu.
Among the various candlestick formations observed in technical analysis, the bullish marubozu commands attention as it appears in the charts. The market participants interpret this as a sign of decisive participation, particularly near support-resistance zones or during uptrends or downtrends. Its presence can alter short-term expectations and influence trading decisions, especially when assessed alongside confirmation indicators such as volume, RSI, or EMA.
Read further to find structured identification rules for bullish marubozu, confirmation methods, and practical trading applications.
What is a Bullish Marubozu candle?
A Bullish Marubozu is a single candlestick pattern in technical analysis that reflects strong and uninterrupted buying pressure during a trading session.
The term “Marubozu” originates in the 18th century from Japanese rice markets and was later introduced by Steve Nison in 1991 in his book ‘Japanese Candlestick Charting Techniques’, representing a session of pronounced and one-sided market conviction. In Japanese, it translates roughly to “bald” or “shaven,” referring to the candle’s defining feature, the absence of upper and lower shadows.
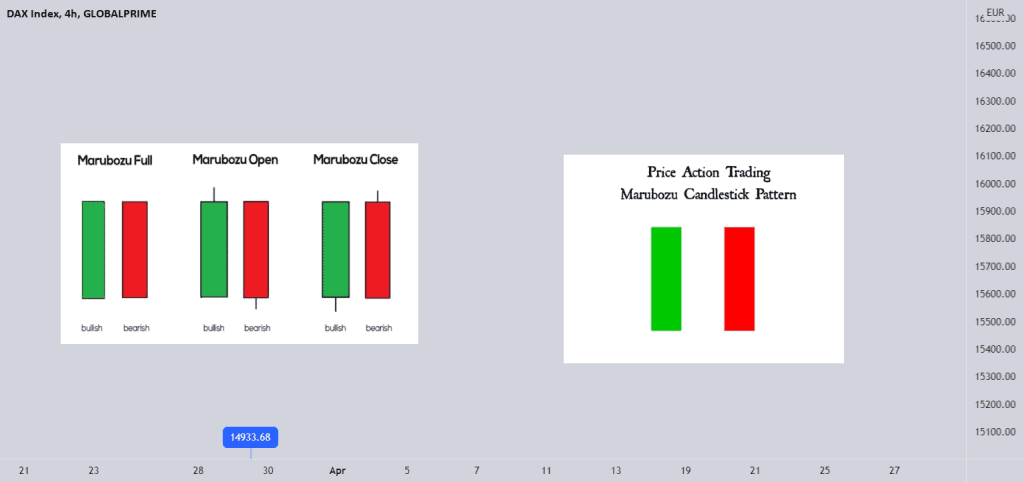
In the above image, the green candles represent Bullish Marubozu patterns, while the red candles represent Bearish Marubozu patterns.
Structurally, a bullish marubozu opens at its low and closes at its high, forming a long bullish body with little to no wicks. This construction indicates that buyers were in control from the opening bell to the close, leaving no meaningful retracement during the session.
From a price action perspective, the pattern signifies decisive demand, as there is no visible evidence of sustained selling pressure within that candle. For this reason, traders often interpret it as a display of conviction rather than hesitation.
How to identify a valid bullish marubozu?
A valid bullish marubozu is not merely a long green candle. It is a structured expression of sustained buying pressure, and its identification requires discipline.
- Body structure: The candle must have a long real body with the close occurring at or extremely near the high of the session, and the open at or very near the low. The absence of upper and lower shadows distinguishes it from ordinary bullish candles.
- Minimal wicks: In practical markets, perfect wickless candles are rare. Therefore, tiny shadows may be tolerated, provided they are negligible relative to the total body size.
- Relative size: The candle should be visibly larger than recent candles. A bullish marubozu that forms within narrow consolidation lacks authority.
- Volume confirmation: A bullish marubozu is usually accompanied by expanding volume.
Market psychology of bullish marubozu
The bullish marubozu reflects a session of sustained and unilateral buying pressure. From the opening trade to the close, demand overwhelms supply, leaving little or no intraday retracement. The sellers attempt to offer resistance but fail to regain control, which results in a close near the session high.
When a bullish marubozu appears after a decline, it may indicate emerging accumulation and a shift in sentiment. While within an established uptrend, it often signals momentum expansion. Its psychological message is straightforward: buyers dominated the session with conviction, though confirmation remains essential.
Where does a bullish Marubozu work best?
The effectiveness of a Bullish Marubozu depends on its position within the prevailing trend structure and nearby support and resistance levels. The context determines whether the candle reflects continuation strength or emerging reversal pressure.
1) In an uptrend (continuation signal)
Within an uptrend, a bullish marubozu usually signals expansion of momentum. When it forms near support within the trend channel, it suggests that buyers are defending lower levels and reasserting control. In such conditions, the pattern frequently precedes continuation toward higher resistance zones.
2) After a downtrend (potential reversal)
Following a decline, a bullish marubozu forming near the support area may align with established trend reversal patterns. Persistent buying throughout the session indicates that selling pressure is being absorbed and that demand is re-entering the market. Such price behaviour suggests the early stages of accumulation. However, confirmation through subsequent follow-through and strength in closing prices remains necessary before concluding that a structural reversal is underway.
3) Breaking resistance / leaving consolidation
The pattern is effective when it closes decisively above resistance after a period of consolidation, aligning with a structured breakout trading strategy. A close at new highs reflects market acceptance of higher price levels and expanding demand. In this setting, the bullish marubozu suggests that the prior supply has been absorbed and that the balance between supply and demand has shifted in favour of the buyers.
How to Confirm Bullish Marubozu?
A bullish marubozu requires confirmation so that it strengthens probability and reduces premature entries, and integrating volume analysis, price structure, and technical tools improves reliability.
Confirm with volume expansion
A bullish marubozu accompanied by expanding volume suggests institutional involvement and real demand. Without increased volume, the candle may reflect temporary enthusiasm rather than sustained accumulation.
Confirm with key levels
When the bullish marubozu pattern forms near an established support or breaks above resistance, its validity increases. And, the closes above significant levels demonstrate acceptance of higher prices, reinforcing directional bias.
Confirm with indicators
The RSI indicator can support the signal when it reflects strengthening momentum without entering extreme overbought territory. Alignment with a rising exponential moving average further reinforces directional bias by confirming trend support. Indicator confirmation may validate the existing momentum structure and reduce the probability of acting on a false breakout.
Trading setups (step-by-step)
A bullish marubozu establishes directional bias, but trade execution must be governed by confirmation rather than assumption.
Step 1: Continuation breakout entry (next candle/break of high)
In an existing uptrend, a continuation entry may be taken on the break above the Marubozu’s high or at the open of the next candle if strength persists. This approach indicates continuation of upward momentum and suggests that demand remains dominant in the immediate term.
Step 2: Pullback entry (mid-body or prior resistance retest)
A more conservative method involves waiting for a retracement toward the midpoint of the Marubozu’s body or a retest of prior resistance turned support. This improves risk-reward alignment while maintaining bullish bias.
Step 3: Reversal entry (after downtrend + follow-through)
Following a sustained decline, a reversal entry requires confirmation through subsequent strength. A continued rise beyond the Marubozu’s high provides evidence that accumulation is replacing prior distribution.
Risk management (the part competitors underplay)
Risk management in trading defines the difference between structured participation and speculation. The pattern may signal strength, but the preservation of capital must take precedence over the pursuit of opportunity.
Stop loss placement
A stop-loss is generally placed below the low of the Marubozu, since a decline beneath that level contradicts the premise of sustained buying interest. For pullback entries, the stop may be positioned beneath the retracement low or an established support area.
Targets
In such situations, profit objectives are commonly determined by prior resistance levels, measured price projections, or continuation within the prevailing trend. The target selection must maintain an appropriate risk-to-reward relationship consistent with disciplined trading practice.
Bearish vs Bullish Marubozu
The table describes the key differences between bearish and bullish marubozu candlestick patterns:
| Feature | Bullish Marubozu | Bearish Marubozu |
| Colour & Structure | Green/white, with little or no upper and lower shadows | Red/black, with little or no upper and lower shadows |
| Open & close position | The opening price occurs at or near the session low, closing price at or near the session high | The opening price occurs at or near the session high, closing price at or near the session low |
| Trend | It reflects an upward price movement and bullish behaviour | It reflects a downward price movement and bearish behaviour |
| Trend confirmation | In an uptrend, confirms continuation of upward momentum | In a downtrend, confirms continuation of selling pressure |
| Market psychology | It indicates sustained buying interest with buyers controlling the session | It indicates persistent selling pressure with sellers controlling the session |
| Trading strategy | It is interpreted as a signal to initiate or add to long positions | It is interpreted as a signal to initiate or add to short positions |
| Reversal implications | At the end of a downtrend, it may indicate potential reversal if follow-through appears | At the end of an uptrend, it may indicate potential reversal if subsequent weakness develops |
Conclusion
The bullish marubozu represents a session of decisive buying pressure in which demand remains dominant from open to close. Its significance, however, lies in its position within the overall trend and its relationship to support and resistance. When it is confirmed by volume and follow-through, it may signal continuation or reversal. As with all technical tools, disciplined risk management remains essential.
FAQ‘s
A bullish marubozu indicates a sustained buying interest throughout the trading session. The price opens near the low and closes near the high, which reflects minimal intraday selling pressure. The pattern suggests strong demand, though its implication depends on the surrounding trend structure and confirmation from subsequent price action.
The Marubozu may function as either a continuation or a reversal signal depending on the context. Within an uptrend, it often confirms momentum. After a decline, it may indicate a potential reversal. Its interpretation requires evaluation of prior trend direction and follow-through behaviour.
Trading a bullish marubozu usually involves entering on a breakout above the candle’s high or waiting for a controlled pullback toward support. The confirmation through volume expansion and alignment with prevailing trend conditions improves reliability. Additionally, stop losses are placed below the candle’s low as a risk management mechanism.
The reliability of the bullish marubozu depends on context, volume, and confirmation. When it is supported by strong participation and support-resistance level breakouts, it may offer meaningful signals. Without confirmation, however, it can represent short-term enthusiasm rather than sustained directional movement.
A Marubozu reflects decisive control by one side of the market, characterised by a long body and little or no shadows. A Doji, by contrast, shows near equality between open and close, signalling indecision. The two patterns represent opposite expressions of market sentiment.
The bullish marubozu can be applied in intraday trading, particularly during breakout conditions or strong momentum phases. Its effectiveness increases when it is supported by volume expansion and alignment with the higher timeframe trend direction.