In the ever-evolving landscape of financial markets, to trade successfully requires a keen understanding of various tools and strategies. Among these, technical analysis stands tall as a cornerstone strategy, offering you invaluable insights into price movements and potential reversals.
At the heart of technical analysis lie reversal candlestick patterns, a set of visual cues that help you identify significant shifts in market sentiment and trend direction. When you start to understand how to spot these patterns and what they mean, you can start to anticipate potential trend changes that could act as great trading opportunities.
In this article, we delve into the fascinating world of reversal candlestick patterns, shedding light on their importance and demonstrating how they serve as invaluable tools for traders in their quest for consistent profitability.
What is Reversal Candlestick Pattern?
Candlestick reversal patterns are what the name suggests – patterns that identify reversals in the market sentiment. This could be in either direction, bullish or bearish. Typically, patterns that signal a turn from a bullish to a bearish market are called ‘bearish reversal patterns’ and vice versa.
There are several candlestick patterns, each with its own distinct characteristics and implications. Here are some of them.
The Hammer and Hanging Man patterns
The Hammer
This is a bullish reversal pattern, which means it forms typically after a downtrend to signal an upcoming uptrend. It is named for its resemblance to a hammer, with a short body near the top of the candlestick and a long lower shadow that is at least twice the length of the body. The long lower shadow signifies that sellers pushed prices significantly lower during the session, only for buyers to regain control and push the prices back up by the end.
When traders see the Hammer, they interpret it as a potential signal that the downtrend might be losing momentum and that a bullish run could be imminent.
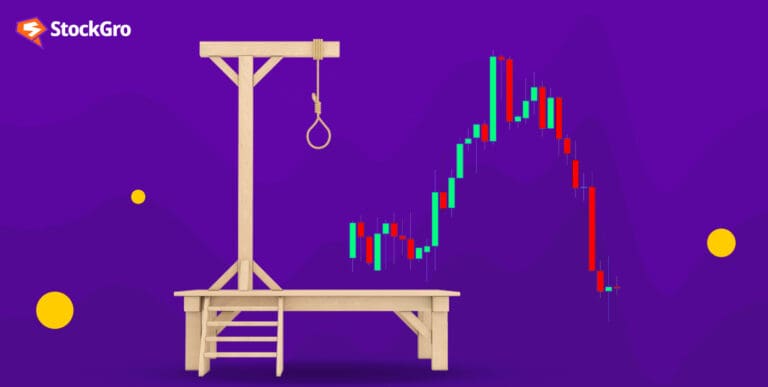
The Hanging Man
The Hanging Man pattern, on the other hand, is a bearish reversal pattern that forms after an uptrend. Like the Hammer, it has a small body and a long lower shadow. The important difference here is that the Hanging Man appears at the top of an uptrend, signalling potential reversal from a bullish movement to a bearish one.
The Hanging Man suggests that despite an initial attempt by buyers to continue the uptrend, selling pressure intensified, causing prices to retreat significantly from their highs.
Engulfing patterns
Engulfing patterns are reversal indicators on either side. Generally, they involve two candles with the latter candle ‘engulfing’ the entire body of the candle right before it. The engulfing candle can be bullish or bearish, depending on where it forms with respect to the continuing trend.
Bullish engulfing
A bullish engulfing provides the strongest signal when it is seen at the bottom of a downtrend. This is characterised by a larger green candle engulfing a smaller red candle. This shows that buyers are piling into the market with aggression and provides a bias for reversed upward momentum.
Bearish engulfing
This is simply the opposite of a bullish engulfing. Typically occurring at the top of a bull run, it looks like a large red candle engulfing a smaller red one. A pattern like this signals a reversal of an existing upward trend that could potentially reverse. Bearish engulfing is a reversal pattern that signals a bearish return in a bullish market.
Engulfing patterns are usually used for spotting trend reversals. They could also be used to identify trend continuations. For example, a bullish engulfing during an uptrend could provide more confidence that the trend will continue. Reversal patterns are usually great indicators of opportunities to either enter or exit the market.
Doji
The word Doji comes from a Japanese phrase that means ‘the same thing.’ This candlestick, hence, indicates that the price closed where it opened during the candle’s time period. While they may not seem like much, they’re important additions to your trading arsenal.
Doji candlesticks usually also help traders identify reversals, or market tops and bottoms. For instance, a Doji candlestick that forms during an uptrend could indicate bullish exhaustion – that is, the market’s shifting towards the sellers from the buyers.
There are several kinds of Doji patterns and they all have their own meanings depending on the position and length of the shadow.
- Neutral Doji – This is a Doji with an almost invisible body located in the middle of the candlestick, with the upper and lower wicks of similar lengths. This pattern appears when bullish and bearish sentiments are balanced.
- Long-legged Doji – The long-legged Doji has longer wicks, suggesting that buyers and sellers have tried to take control of the price action aggressively at some point during the candle’s timeframe. Depending on where the next candle closes (and other indicators like RSI), this Doji could both indicate a reversal or a continuation.
- Dragonfly Doji – The Dragonfly Doji appears like a T-shaped candle with a long lower wick and almost no upper wick. It means that the open, the close, and the high price are almost at the same level. When seen at the bottom of a downtrend, the Dragonfly is seen as a strong buy signal.
- Gravestone Doji – A Gravestone Doji represents an inverted T-shaped candlestick, with the open and close coinciding with the low. The candlestick indicates that the buyers tried to push the market price up but couldn’t hold it long enough for the candle to close.
Rising 3 Candlestick Pattern
The Rising 3 Candlestick Pattern is mainly a bullish continuation trading pattern but is also identifiable as a subtle Reversal Candlestick Pattern under specific conditions.
It usually forms during an uptrend in such a way that shows that even though a slight correction occurs, the dominant trend is still bullish. This pattern consists of five candlesticks:
- First candle: A long bullish candle indicating strong upward momentum.
- Next three candles: These are smaller bearish or neutral candles that move downward but stay within the range of the first bullish candle. This shows that while sellers are attempting to take control, they’re not able to push the price significantly lower.
- Fifth candle: A strong bullish candle that closes above the first candle’s high, confirming the continuation of the upward trend.
The significance of the Rising 3 Candlestick Pattern lies in its ability to show that buyers are still in control, even during short-term corrections. The pattern suggests that sellers attempted to push the price lower, but were unable to overpower the overall bullish sentiment, leading to a resumption of the uptrend.
Traders use this pattern to identify entry points in an ongoing trend, as it signals that the market is likely to continue moving higher after the temporary pause. However, as with all candlestick patterns, confirmation from other technical indicators or chart patterns is often needed to validate the signal.
Morning Star Candlestick Pattern
The Morning Star Candlestick Pattern is a reversal candlestick pattern that indicates a potential change in trend from a downtrend to an uptrend. It typically forms over three trading sessions and is considered a strong signal for those looking for a bullish reversal.
The pattern begins with a long bearish candle, reflecting strong selling pressure in the market. This is followed by a small-bodied candle (often referred to as a doji or spinning top), which indicates indecision among traders as the selling momentum weakens. The final candle is a long bullish candle, showing that buyers have regained control and are pushing prices higher.
The significance of the Morning Star pattern lies in its ability to demonstrate a clear shift in market sentiment. The first candle confirms the existing downtrend, the second shows hesitation, and the third confirms the reversal by closing above the midpoint of the first candle.
Traders often use this pattern in conjunction with other indicators to validate the potential trend reversal. Recognizing the Morning Star in time can help traders position themselves early in an emerging uptrend, making it a valuable tool in technical analysis.
Evening Star Candlestick Pattern
The Evening Star Candlestick Pattern is a well-known Reversal Candlestick Pattern that signals the potential end of an uptrend and the start of a downtrend. This pattern is composed of three candles.
- The first candle is a long bullish candle, indicating strong buying pressure and an ongoing upward movement.
- The second candle is typically small in size, either bullish or bearish, and represents indecision in the market. It reflects the weakening of the upward momentum as buyers and sellers struggle for control.
- The third candle is a long bearish candle, which confirms that the sellers have taken over, pushing the price downward.
Reversal candlestick patterns often appear at the top of an uptrend and serve as warning that the bulls are losing strength, and the market may reverse into a bearish phase. Traders use this pattern to time their exits from long positions or to consider short-selling opportunities.
For a stronger confirmation of the reversal, the third candle should ideally close below the midpoint of the first bullish candle, which shows a significant shift in market sentiment.
Conclusion
Reversal candlestick patterns like the one discussed above are for traders who want to visualise when a market’s trend might be changing. They can be used as reliable metrics not by themselves, but in conjunction with other factors of technical analysis like volume changes, RSI, trend lines, etc. Using these patterns solely at their merit is calling for trouble since technical analysis is a very complicated science. Here is an example analysis. Good luck!
FAQ’s
The most powerful reversal pattern is often considered to be the Double Top (bearish) and Double Bottom (bullish). Other notable patterns include the Head and Shoulders (bearish) and Inverse Head and Shoulders (bullish). These patterns are reliable indicators of a trend change when confirmed by volume and other technical indicators.
Yes, a bullish reversal is good if you’re looking to enter long positions. It indicates that the market trend is shifting from bearish to bullish, potentially signaling the start of an uptrend. However, always confirm the pattern with other indicators before acting on it.
To confirm a reversal:
Volume: Look for increased volume during the pattern formation.
Support/Resistance: Ensure the reversal occurs at key support or resistance levels.
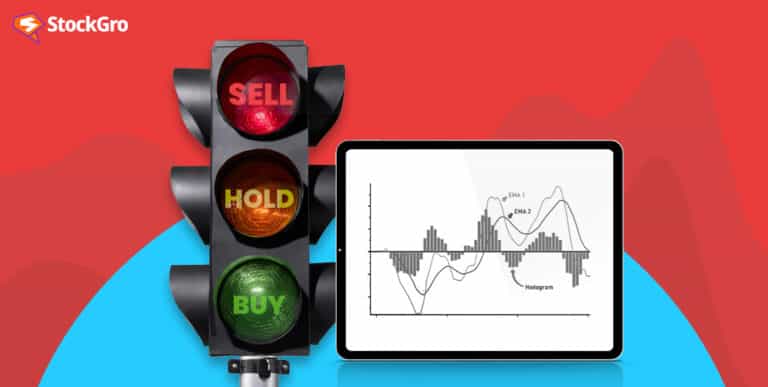
Indicators: Use indicators like RSI or MACD to check for overbought/oversold conditions.
Candlestick patterns: Look for candlestick patterns like Engulfing or Hammer that support the reversal.
Using other indicators with reversal candlesticks helps:
Increase accuracy: Confirm the pattern’s validity and reduce false signals.
Identify trend strength: Use tools like RSI or MACD to gauge the momentum of the reversal.
Avoid false reversals: Market noise can lead to false reversals, so combining candlestick patterns with indicators helps filter out unreliable signals.