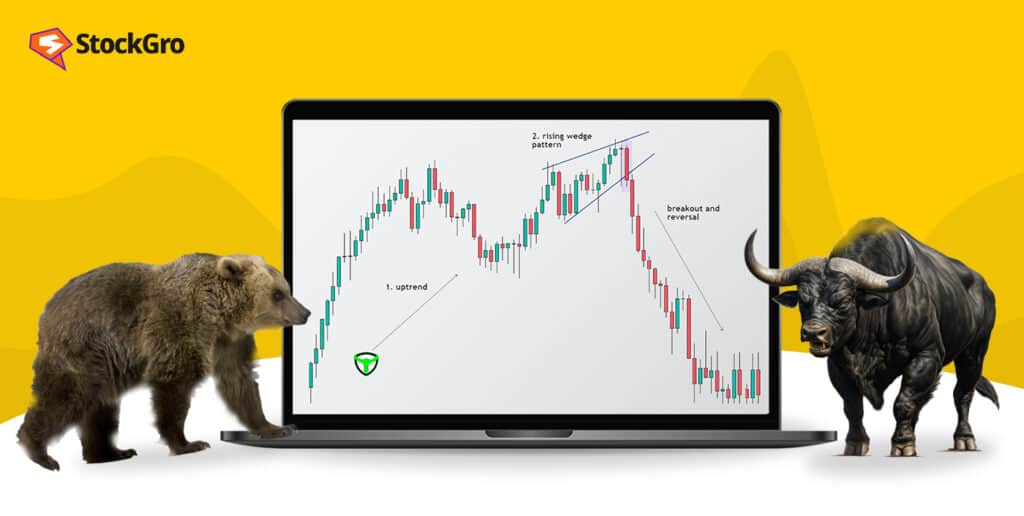
In the world of technical analysis, price patterns often reveal what raw numbers cannot. One such powerful formation is the Rising Wedge Pattern. At first glance, the rising prices give a bullish impression. However, behind this move, buying strength weakens while selling pressure slowly increases.
This pattern can be confusing for traders and can lead to false signals. Let’s understand the rising wedge pattern, its formation and how to use it for trading.
What is the Rising Wedge Pattern?
A rising wedge pattern is a chart formation that appears when prices continue to move higher within two converging trendlines.
While both the support and resistance lines are rising, the support line climbs at a faster pace, gradually squeezing the price into a narrow, wedge-shaped structure.
Although the price is making higher highs and higher lows, the pace of upward movement slows down. The loss of momentum leads to a bearish breakout, making the rising wedge a reliable reversal or continuation pattern.
Characteristics of Rising Wedge Chart Pattern
These characteristics are associated with the rising wedge pattern:
- Upward Price Movement
The rising wedge forms during an upward price movement, either in an uptrend or during a corrective rally in a downtrend. - Converging Trendlines
As the support line rises faster than the resistance line, the trendlines start converging. - Fall in Volume
The trading volume falls as the pattern appears. The drop in volume shows weakening buying pressure. - Bearish Breakout
The pattern completes when the price breaks below the lower trendline, often followed by an increase in the selling volume.
Formation of Rising Wedge Pattern
Let’s understand how the rising wedge pattern forms with the help of a real-life example. The following chart shows the formation of a rising wedge pattern in GAIL India during mid-December 2025 to early January 2026:
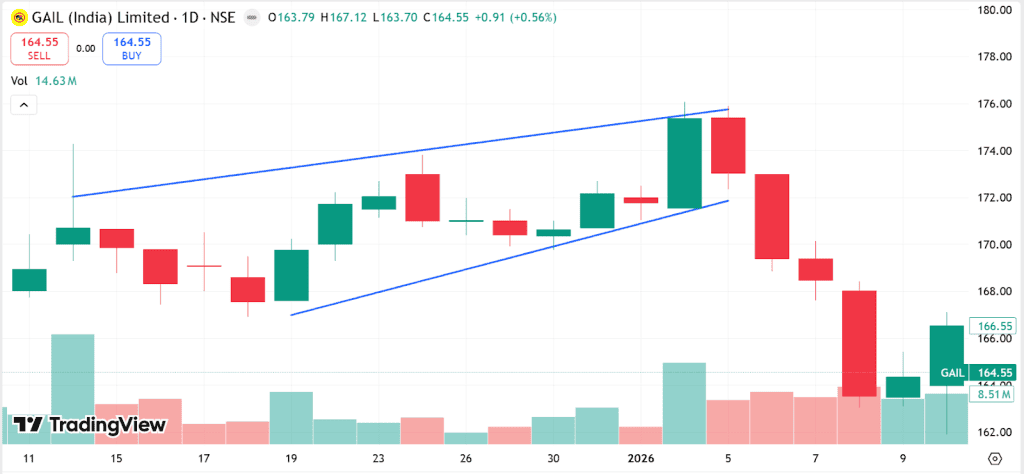
- Price Trend: GAIL’s stock price moved from around ₹168 to ₹176, forming higher highs and higher lows in a narrow range.
- Pattern Structure: The resistance line climbed slowly while the lower support rose faster, creating a rising wedge formation.
- Momentum signal: Trading volume remained relatively low during the upward move, indicating the weakening strength of the buyers.
- Breakdown: The price broke down in early January 2026, falling below the support, dropping to ₹164–165.
How to Trade Using the Rising Wedge Candlestick Pattern?
Patience and validation are required for trading the rising wedge candlestick pattern. You can take a practical approach to trade with it efficiently.
Step 1: Identify the pattern
Start by identifying the rising wedge pattern. Draw two rising trendlines connecting the swing highs and swing lows. Make sure both lines are converging.
Step 2: Wait for confirmation
Do not take a position as soon as you notice the pattern; wait for the price to fall below the lower trendline.
Step 3: Check the volume
See if the trading volume has increased during the breakdown. It confirms that sellers are gaining strength.
Step 4: Entry point
Only enter the trade when the price has closed below the support line. It confirms that sellers have gained control.
Step 5: Stop-loss
To limit losses and effectively manage risk, you should place the stop-loss above the last swing high or resistance line.
Strategies for Trading Rising Wedges
Traders can use the following strategies with rising wedges:
Strategy 1: Breakdown Confirmation Strategy
The breakdown confirmation strategy focuses on entering a trade after the price breaks below the supporting trendline. This helps in avoiding false signals and ensuring that bearish momentum is confirmed before taking a position.
Example
Suppose a stock forms a rising wedge within ₹120 to ₹130. Now, if the price falls below the support at ₹117, check the volume for confirmation of the breakdown.
If the volume starts increasing after the breakdown, enter a short position at this price. Set the stop-loss near ₹132, and place the target close to ₹110.
Strategy 2: Retest Entry Strategy
After the price breaks down below the supporting trendline, they often jump to retest the broken level before falling further down. Using this strategy allows entry at better prices with lower risk.
Example
Suppose a stock is trading between ₹ 250 and ₹ 260. This is followed by a breakdown below ₹ 250, the price starts inching up to ₹ 252, but fails to sustain and starts dropping again.
Take a short position near this level and set a downside target of ₹235. The stop-loss can be placed close to or slightly above ₹260.
Strategy 3: Volume Confirmation Strategy
The volume confirmation strategy relies on the volume behaviour to confirm the breakout’s validity. When the rising wedge breakout is followed by high volume, it indicates strong selling pressure and the start of the bearish trend.
Example
Assume a stock forms the rising wedge between ₹400 and ₹420 with declining volume. After breaking below ₹395, the trading volume rises, confirming the bearish momentum.
Enter near ₹395, placing a stop at ₹425. Place the target close to ₹375.
Rising Wedge Pattern Vs Falling Wedge Pattern
The rising wedge pattern differs from the falling wedge pattern in the following aspects:
| Parameter | Rising Wedge Pattern | Falling Wedge Pattern |
| Direction of Trendlines | Both trendlines slope upward | Both trendlines slope downward |
| Signal Type | Indicates bearish reversal | Signals bullish reversal |
| Breakout Direction | Price breaks below support line | Price breaks above resistance line |
| Market Psychology | Buyers losing strength gradually | Sellers losing strength gradually |
| Trading Bias | Favours short selling opportunities | Favours long buying opportunities |
Conclusion
The rising wedge pattern appears when the bullish momentum is fading. The narrowing range and lower volume suggest that buyer confidence is eroding as selling pressure quietly builds beneath the move. The prices may continue to rise, but that doesn’t last long.
The rising wedge pattern can be a useful trading tool when combined with technical indicators and a broader market context.
FAQs
A rising triangle is generally considered bullish, whereas a rising wedge is bearish, despite both showing upward price movement.
The pattern reflects buyers gradually losing strength while sellers quietly build positions, eventually leading to a bearish breakdown.