The falling wedge is a fascinating pattern that has caught the attention of many traders, from rookies to professionals. But what makes it so captivating? It is like a hint from the stock market. It whispers in the ears of smart traders, “Hey, good times are coming.”
Understanding this pattern can give you an edge, helping you make informed decisions. Let’s understand how the falling wedge pattern works and how you can use it to enhance your trading game.
What is the falling wedge pattern?
The falling wedge pattern is a shape that stock prices make on a graph. Imagine a triangle where the two sides are getting closer to each other as they go down. This pattern suggests that even though prices are falling for now, they are likely to go up soon.
- What’s special about it?
The falling wedge pattern usually occurs when a stock is overall doing well, but then it starts to fall for a bit. This pattern tells traders that the drop is likely temporary, and soon the stock price may rise again. This is why it’s known as a “bullish” pattern.
- Difference from other patterns
You might wonder how the falling wedge is different from other patterns like the descending channel. In simple terms, a descending channel has two sides that run parallel to each other, going downwards. But in a falling wedge, the lines converge, meaning they get closer as you move along the time axis.
You may also like: Deciphering the rising wedge pattern in stock trading
Recognizing the falling wedge pattern
Recognizing a falling wedge pattern is like solving a small puzzle. Let’s break it down.
- Spotting the trend
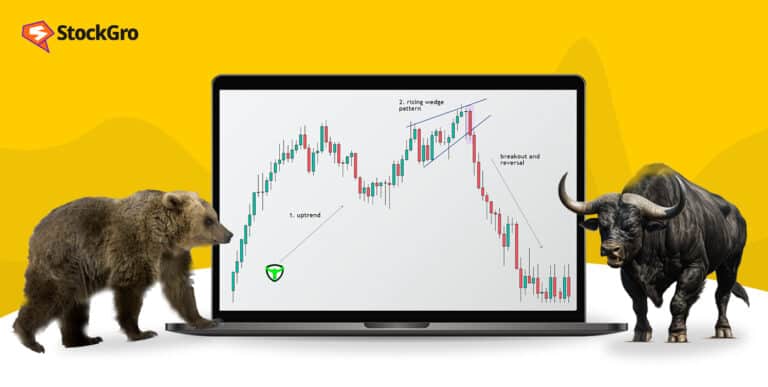
First, look at the larger trend of the stock. Is it mostly going up, despite some downs here and there? If yes, you are more likely to spot a falling wedge pattern.
- Watching the lines
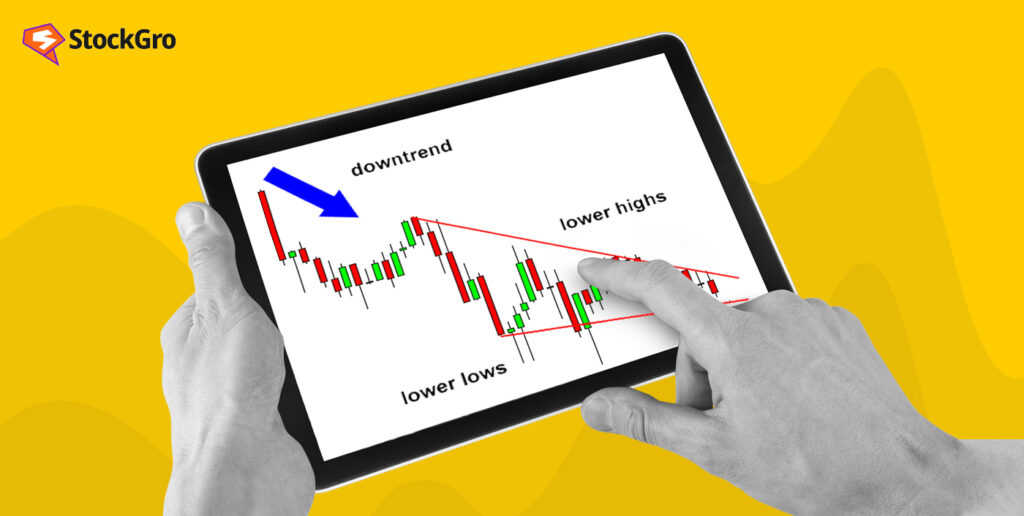
Draw two trend lines on the price graph of the stock. The top line should connect the decreasing peaks, and the bottom line should connect the decreasing lows of the stock price. If the lines are getting closer to each other, congratulations, you might have found a falling wedge pattern!
- Mind the volume
Notice how much of the stock is being bought and sold. If the volume is getting lower as the price moves within the falling wedge, it’s usually a good sign. This low volume means that soon there could be a sudden spike in trading, often leading to the stock price going up.
How to trade the falling wedge pattern
Trading is where the rubber meets the road. Let’s discuss how you can actually use the falling wedge pattern to make trading decisions.
- Timing is everything
Once you see a falling wedge pattern forming, keep an eye on it. If the stock price breaks through the upper trend line and closes above it, it might be a good time to buy.
- Plan your trade
Choose your entry point carefully. It could be as soon as the stock price breaks out of the pattern or you might wait for a small dip to get a better price. Be ready to set your stop loss and take profit levels as well.
- Example trade
Let’s take an example of a well-known Indian company, Infosys. Imagine the stock is trading at ₹1300, and you identify a falling wedge pattern. You could set a buy entry at ₹1315, with a stop loss at ₹1290 and a take profit at ₹1350. This way, you’re risking ₹25 to potentially make ₹35 per share, which is a reasonable risk-reward ratio.
Why the falling wedge pattern is popular among traders
The falling wedge pattern has found a special place in the toolbox of many traders. Its allure lies in its simplicity and effectiveness. Let’s explore more.
- A simple visual cue
The falling wedge pattern can easily be spotted on a chart, even by beginners. You don’t need complex algorithms or software to identify it.
- High success rate
Many traders have found the falling wedge to be a reliable predictor of a bullish move, especially when it’s confirmed by other indicators like volume.
- Versatile use
The falling wedge pattern is not only limited to a particular kind of asset. You can find this pattern in stocks, forex, commodities, and even in cryptocurrencies.
Also Read: Bullish engulfing candlestick pattern: Learn how to spot trend reversals
The psychology behind the falling wedge pattern
Understanding why the falling wedge pattern forms can give you an even deeper insight into market behavior. Let’s find out.
- The initial downtrend
Initially, more people are selling than buying. This is the reason you see the price falling. However, the fact that the lines are converging suggests that the sellers are losing steam.
- The turnaround point
At some stage, the buyers find the price too attractive to ignore and start buying, while the sellers start holding back. This causes the price to break out of the pattern and typically move upwards.
- The surge in volume
Often, as soon as the breakout occurs, many traders jump on the bandwagon and you’ll see a surge in volume. This is usually a good sign that the pattern was valid and that the stock price will continue to rise.
Practical tips for trading the falling wedge pattern
Now that you know the basics, here are some practical tips to improve your wedge trading pattern strategy.
- Use supporting indicators
Though the falling wedge pattern is powerful, it’s always good to use other indicators like moving averages or RSI to confirm your decision.
- Be mindful of false breakouts
Sometimes the price might break the upper line but then reverse. This is known as a false breakout. Always have a stop loss to protect your investment.
- Demo before diving in
If you’re new to this, use a demo account to practice identifying and trading the falling wedge pattern.
Key elements of a falling wedge pattern
| Element | Description |
| Prior Trend | Should be a noticeable downtrend for a reversal pattern. |
| Resistance Line | Formed by at least two reaction highs, ideally three. |
| Support Line | Requires at least two reaction lows for formation. |
| Convergence | Support and resistance lines should converge as the pattern matures. |
| Breakout | Confirmed by a breach of the resistance line, ideally with high volume. |
| Trading Volume | High volume during the breakout indicates stronger bullish confirmation. |
Is the falling wedge pattern always a bullish sign?
The short answer is that the falling wedge pattern is generally considered a bullish indicator, but like all trading patterns, it’s not foolproof. Here’s a deeper dive into its bullish nature:
- Market psychology driving bullish trends
The falling wedge typically signals that although the asset has been declining in price, the speed of that decline is slowing down. This could mean that the sellers are running out of steam, and the buyers are starting to take control. The eventual breakout upwards is usually seen as a bullish sign.
- However, context matters.
It’s essential to look at the overall context in which the falling wedge occurs. If the market is overwhelmingly bearish, the wedge might not be as reliable as when it appears in a more stable or bullish market.
What sets the falling wedge pattern apart from the bullish wedge pattern?
If you’re a beginner, the terminology can indeed get confusing. Both terms sound bullish, so what’s the difference?
- Variants of bullish wedge patterns
Firstly, a bullish wedge pattern can either fall or rise. The falling wedge happens when the price is decreasing but is expected to reverse and go up. The rising wedge, although named ‘rising,’ is a bearish pattern indicating that the price may go down.
- The direction of the trend lines
In a falling wedge pattern, both the upper and lower trend lines are angled downwards. In a rising wedge pattern, they are angled upwards. The falling wedge pattern typically signals a reversal from a downtrend to an uptrend, while a rising wedge indicates the opposite.
Also Read: The ABCs of stock market: Consolidation and Breakouts
How long should one wait for a falling wedge pattern breakout?
This is an important question as timing can make or break a trade. Here’s what you should consider:
- Variable timeframes
The falling wedge pattern doesn’t come with a specific time stamp. It can form over a period of days, weeks, or even months. The key is to be patient and let the pattern fully develop.
- Signs to observe
Keep an eye out for a decrease in volume as the wedge narrows, and a sudden increase when the price breaks out. This change in volume can often signal that a breakout is imminent.
Conclusion
The falling wedge pattern has a lot going for it — simplicity, versatility, and a strong track record. By understanding the basics, observing its formation, and applying thoughtful strategies, you can navigate the Indian stock market more confidently.
Practice makes perfect, so don’t hesitate to start identifying falling wedges in the daily charts of companies like Reliance, TCS, or HDFC Bank.
The falling wedge pattern is not a guarantee of success, but it is one of the most trusted signals that traders around the world use. With careful planning and a keen eye, it can become an invaluable part of your trading strategy.