In intricate technical analysis, traders frequently observe candlestick patterns. It is a powerful tool to know the potential market trends or sentiments. Among various candlestick patterns, the inverted hammer is utilised as a compelling indicator of potential trend reversals.
Recognised for its distinctive shape, it offers valuable anticipation in price action. In this article, we will understand its characteristics, formation, significance and interpretation for market dynamics.
What is Candlestick in Trading?
In financial markets, a candlestick is a graphical illustration of price movements. It is commonly used in technical analysis to interpret price movements within a specific time frame – an hour, a day, a week, etc.
An individual candlestick shows four fundamental points – the opening and the closing price, the highest and the lowest price for the chosen period.
A candlestick has two main components – Body and wick. The body represents the price difference between the opening and closing prices. The body colour often indicates if it is bullish (prices moved up) or bearish (prices moved down).
A candle’s Wick/shadows/tail can extend either from the top or the bottom of the body. It depicts the range between high and low prices during a specific duration.
Various candlestick patterns form by the arrangement of body and wick that can provide valuable insights into potential shifts in price trends and market sentiment. One of these patterns is an inverted hammer that traders use to make informed decisions about their entry or exit points.
You may also like: What does the Doji candle tell us about the market?
Inverted Hammer Candlestick Meaning
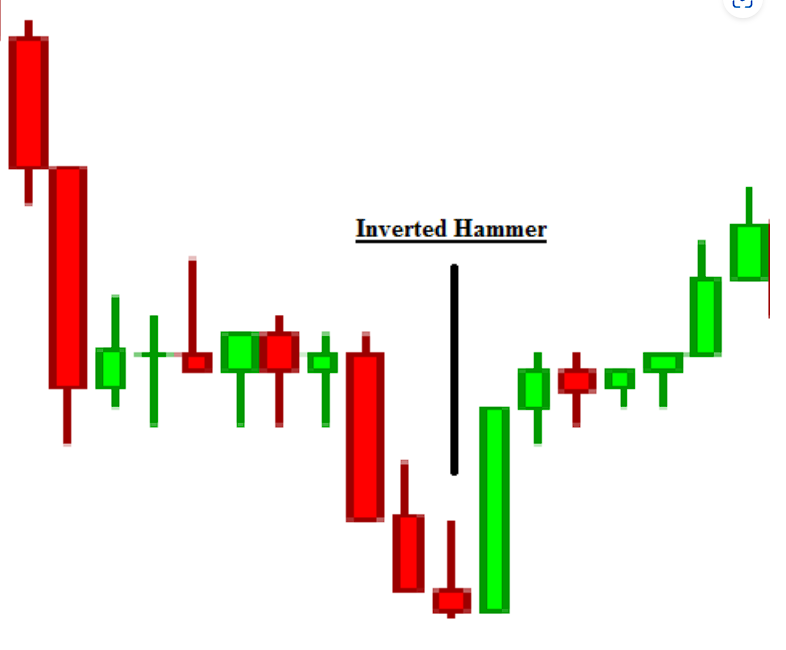
Inverted hammer candlestick meaning can be defined by its unique impression. The name inverted hammer is based on its shape. Visually, it resembles an upside-down hammer or T sign hanging upside down.
- It has a small body, a long upper wick, and little or negligible lower wick.
- The inverted hammer candlestick pattern appears after a downtrend, pointing to a bullish trend turn. This pattern can be seen as a potential reversal signal.
Understanding inverted hammer interpretation
A bullish inverted hammer forms when the opening and lower prices are nearly equal. While a bearish inverted hammer forms when closing and lower levels are near equal. It should be noted that both are strong, bullish indicators. Understand the difference between Bull vs bear market and their key indicators.
The following explanation can help you understand the hammer pattern anatomy:
- Long upper wick: The most noticeable component of the inverted hammer is its long upward wick. This long wick (at least twice of its body), signifies the range between the highest and the lowest price reached during a certain period.
The long upper wick indicates that buyers pushed the price significantly higher during a time frame, but ultimately, they could not maintain those higher levels and the selling pressure or uncertainty among traders.
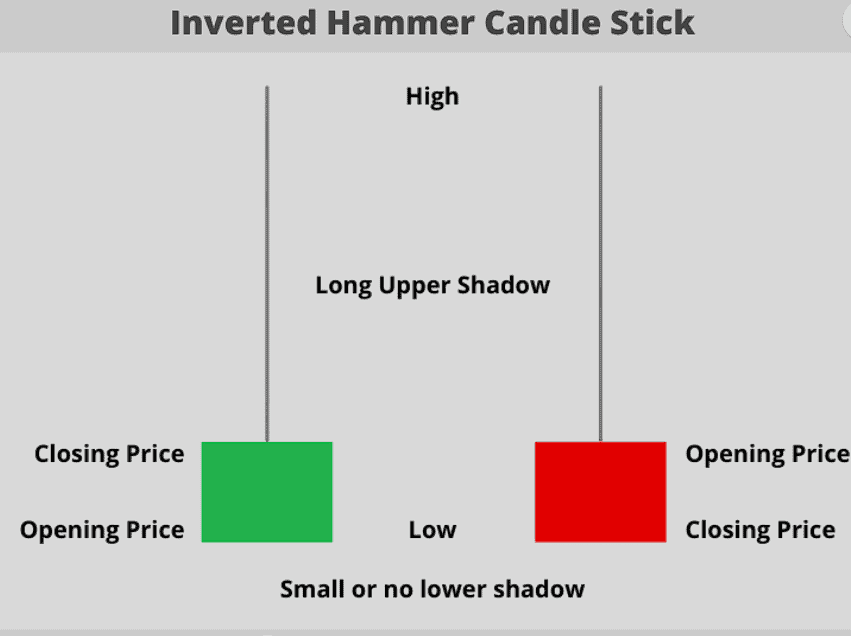
- Small body: The small body suggests relatively little price movement between the opening and closing of the trading session. It shows uncertainty in the market between bulls and bears.You must know that you can even make money when the markets are falling. But then there are bear traps that you must avoid.
- Short lower wick: The short (or negligible) lower shadow indicates very low trading volumes below the opening price. It means sellers could not exercise much impact on the price during the trading session.
For example, the share price of XYZ Enterprises has been experiencing a continuous decline. Its last closing was recorded at Rs.160. The next day, it opens at Rs.165.
It reaches a low level of Rs.161 and a high of Rs.166 within the session. Ultimately, the share price closes at Rs.163, forming an inverted hammer pattern. Over the next two trading sessions, the share price rises to Rs.167, validating the inverted hammer pattern for a potential bullish reversal.
Also Read: How do traders harness the power of Hammer Candlestick patterns?
Traditional hammer vs inverted hammer
Like the traditional Hammer pattern, the Inverted Hammer is a bullish reversal pattern formed with a single candle. It also appears after a downtrend and has one long shadow and another very short (or no shadow).
The key to pinpointing an Inverted Hammer is where its long shadow is located. A simple Hammer’s long shadow develops from the bottom of the body and goes downwards. On the other hand, an Inverted Hammer’s long shadow emerges from the top of the candlestick.
Inverted hammer trading strategy
- It is necessary to note that the inverted hammer candle is seen as an alert for potential price shifts rather than an outright signal to buy. Traders need other indicators and confirmation candles. Read stock market indicators to better understand the market.
- To trade an inverted hammer, traders need to consider its location in the trend. It is a notable reversal signal if it emerges after a sustained downward trend.
However, considering only the hammer pattern is not sufficient. Traders combine it with other technical indicators or analysing tools to enhance its efficiency and anticipation precision.
- Moving averages can help traders to smooth out price data and validate potential reversals. Another technical indicator is the Relative Strength Index (RSI), which can help traders to measure the strength of a price trend reversal denoted by the inverted hammer.
There can be other indicators for potential support and resistance levels and validate the inverted hammer’s signals.
- Rarely do traders rely on inverted hammers as bearish flags (bearish hammer candlesticks), as it can be seen as a trap for bearish sellers with short positions during a downtrend. Read a comprehensive guide to reversal candlestick patterns.
When prices seem to fall further, these sellers can find themselves vulnerable, making them buy their shares back at higher prices to minimise losses. This scenario can set the stage for a trend shift and can drive a quick and significant rise in stock price.
Example of inverted hammer
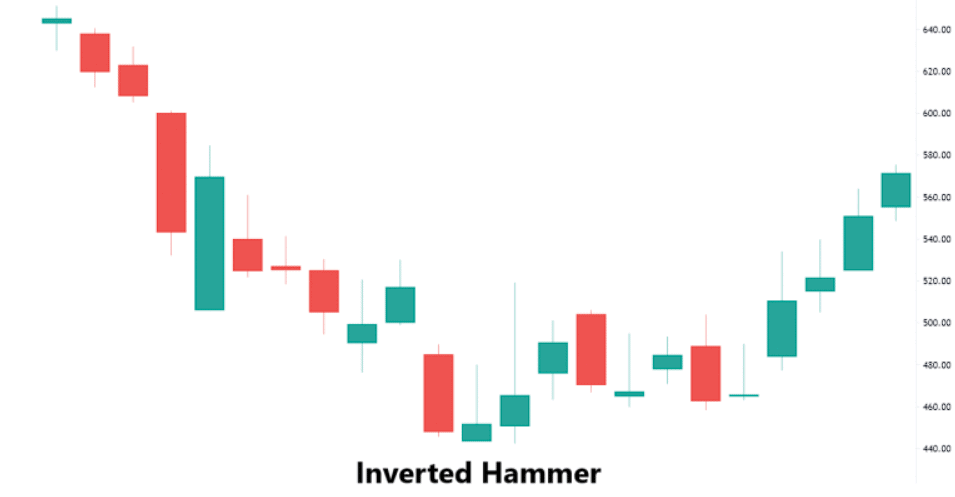
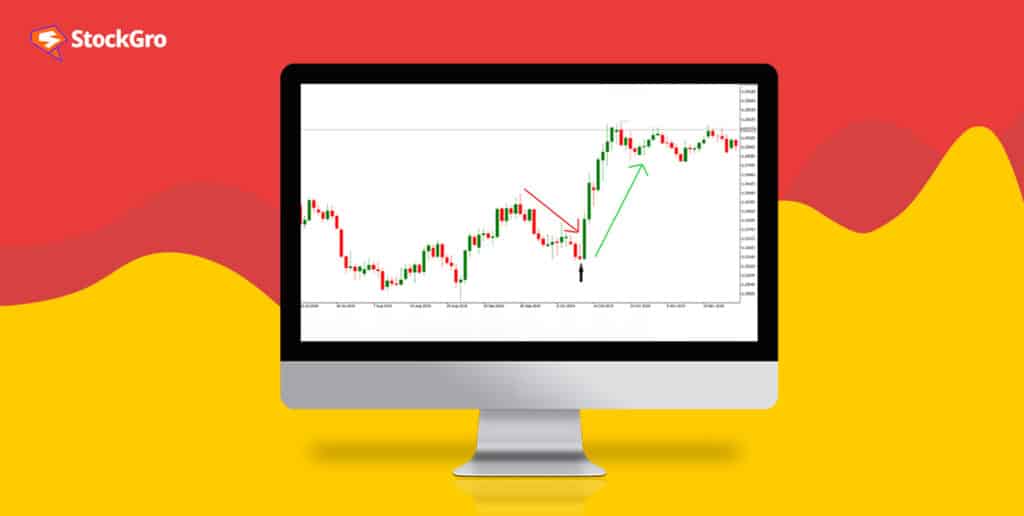
In this chart, you can look at the declining price trend of Company XYZ stock. Pay attention to the bottom-most candlestick forming an inverted hammer. After a significant previous-day fall, the stock opened below and closed slightly higher than its opening price, forming the inverted hammer pattern.
This is the first signal of a potential reversal, indicating the stock might rise. Traders await the next candle. If the green candle goes above the inverted hammer high, it is a buying opportunity with a stop-loss order. In case it is a red candle and the price declines below the inverted hammer, avoid taking any trade as the pattern fails.
The closing
By diving into the inverted hammer, traders can decode what the market whispers regarding trends and reversals. Understand the inverted hammer candlestick pattern that can provide predictive insights to stay ahead of other investors or traders.
Often, experts combine it with other technical indicators and trade with greater trend precision.
FAQs
1. Is an inverted hammer bullish?
Yes, an inverted hammer is typically a bullish reversal pattern, signaling that buyers may be gaining control after a downtrend.
2. What is the difference between red and green inverted hammer?
- Green Inverted Hammer: Closes higher than the opening, showing stronger buying pressure.
- Red Inverted Hammer: Closes lower than the opening, indicating less buying strength but still a potential reversal.
3. What happens after inverted hammer?
After an inverted hammer, a bullish follow-through is needed for confirmation. If the price rises, it supports the reversal; if it falls, the pattern may not hold.
4. Can a bullish hammer be red?
Yes, a red bullish hammer can occur when the price closes lower, but the long lower shadow shows failed selling, hinting at a potential reversal. Confirmation is key.