In trading, price rarely moves in a straight line. It typically follows limitations and creates a pricing channel. When the price deviates from this range, it may signal the start of a persistent trend and pave the way for profitable activities. This can be defined as the channel breakout strategy, where a trader identifies the time when the price is going outside of the normal range and follows that direction.
This is the methodology employed by traders in various markets, including stocks, currencies, commodities, and cryptocurrencies, since a breakout may happen on any time scale. This guide will show you in detail what a channel breakout strategy is, how it occurs, and how you, too, could trade it successfully without making mistakes.
What is a Channel Breakout?
A channel breakout strategy happens when the price breaks above or below the resistance or support of a clearly defined price channel after many moves.
- Resistance is the upper boundary that the price has struggled to cross.
- Support is the lower boundary that the price has struggled to fall below.
The breaking of the price will tend to create strong buying or selling bulls to cause a major shift in that direction when it occurs. This breakout strategy is perceived as an opportunity by the traders who would like to get into a trade early in a new trend.
How Does the Channel Breakout Strategy Work?
The concept behind channel breakout is quite simple but surprisingly effective: once the price breaks out of the established level, the forces that confined it no longer have their grip. At this point, power is transferred to buyers or sellers, and this brings the market to an extreme in their favour.
Here’s the logic in action:
- Price consolidation: The asset fluctuates within a well-defined price range, with highs and lows serving as price constraints.
- The breakout: Traders observe a strong close above or below either the upper or lower range, indicating a potential change of direction.
- Confirmation: Volumes help give credibility to a breakout where there are high volume spikes or any technical indicator, such as RSI or Moving averages.
- The trade: Long/ short positions are opened in the direction of the breakout, and stops are placed to limit risk, should the breakout fail.
Types of Price Channels
Ascending Channel Breakout
Support and resistance lines on an ascending channel are inclined upwards. A price trend is increasing over time, with boundaries that remain parallel.
- Bullish breakout: The price breaks above the resistance line, indicating speed in the bullish rally.
- Bearish breakout: Prices move below the support line, which means the price has already reversed the trend.
Descending Channel Breakout
In a descending channel, both sides fall downwards. Price is moving downwards, yet, swings back and forth between upper and lower resistance levels.
- Bullish breakout: The price breaks above the resistance line and is usually a reversal trend to an uptrend.
- Bearish breakout: A price will drop below the support and the reversal will be extended.
Horizontal Channel Breakout
A horizontal channel is created by sideways movement in price between a level of support and resistance.
- Bullish breakout: The price passes above the resistance and closes above, demonstrating that the buyers have dominated.
- Bearish break: The price is now below the support line, implying that the sellers are overwhelming the buyers.
How to Identify a Channel Breakout
In order to identify a channel breakout strategy:
- Mark the channel: The price range is clearly drawn by drawing parallel lines by connecting several highs (resistance) to lows (support) on the swing.
- Wait for a positive close: The price needs to close past one of the boundaries and not merely poke it out in order to certify the vigour of the move.
- Track volatility and momentum: A rise in volatility, higher candles, or a quickened pace as price nears the limit usually indicates a pending breakout.
- Confirm then act: Filter false breakouts with indicators (such as volume, RSI, or MACD), and increase entry accuracy.
Indicators to Confirm Channel Breakouts
Here are some of the indicators that can help you in confirming a channel breakout:
Moving Averages
- Moving averages help identify the underlying trend.
- A breakout aligned with the direction of the 50-period or 200-period moving average has higher reliability.
- Example: Price breaks above the channel while also crossing above the moving average.
Volume Indicators
- Breakouts with rising volume suggest genuine interest from traders.
- Tools like On-Balance Volume (OBV) or Volume Oscillator can be used.
- Example: A bullish breakout accompanied by volume higher than the recent average is stronger.
RSI or Momentum Indicators
- The Relative Strength Index (RSI) shows whether momentum supports the breakout.
- For bullish breakouts: RSI above 50 adds confidence.
- For bearish breakouts: RSI below 50 adds weight to the signal.
Channel Breakout Trading Strategy Steps
Step 1: Define the Channel
- Identify at least two swing highs and two swing lows to draw parallel lines.
- Ensure the channel has lasted long enough to be meaningful, ideally, at least 20–30 bars.
Step 2: Spot Breakout Levels
- Mark the exact price level where the breakout will be confirmed.
- For bullish setups, this is just above resistance; for bearish setups, just below support.
Step 3: Confirm with Indicators
- Look for agreement between the breakout direction and indicators like moving averages, RSI, or volume.
- Multiple confirmations reduce the risk of false signals.
Step 4: Entry and Exit Rules
- Entry: Buy on a bullish breakout confirmation; sell/short on a bearish breakout confirmation.
- Stop Loss: For bullish trades, place just below the channel midpoint or last swing low; for bearish trades, just above the midpoint or last swing high.
- Take Profit: Conservative traders exit when price moves an equal distance to the channel height; aggressive traders trail their stop to lock in profits.
Risk Management in Channel Breakout Trading
Even the best setups can fail. Follow these rules:
- It is generally recommended not to risk more than 1–2% of your capital on a single trade.
- Use stop-loss orders to limit downside.
- Avoid overtrading; not every breakout is worth taking.
- Adjust position size based on volatility.
Common Mistakes to Avoid
- Chasing the move: Entering too late after a breakout has already run far.
- Ignoring volume: Low-volume breakouts are more likely to fail.
- Trading without confirmation: Jumping in before checking momentum or moving averages.
- Forgetting risk management: No stop-loss can lead to heavy losses.
Example of a Channel Breakout Trade
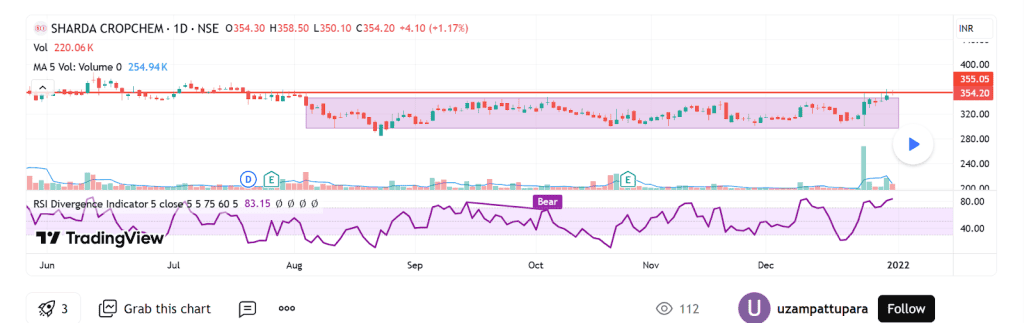
Following an extended period of consolidation, the Sharda Cropchem chart shows a distinct breakout from the channel. The stock’s trading ranged from approximately ₹315 to ₹355, as seen by the shaded region, from August to December. With multiple tests of support and resistance, this consolidation suggests traders are uncertain about their next move.
The price has recently jumped over the top boundary of the channel, which is at approximately ₹355, suggesting that a breakout may be imminent. Strong purchasing interest is shown by the substantial increase in trading volume that accompanies this breakout. Another indicator that suggests potential short-term concern is the relative strength index (RSI), which has entered overbought territory over 80 and reflects bullish momentum. If the stock manages to stay above the channel barrier, this breakout could signal a change from the previous sideways trend to an upward trajectory.
Channel Breakout vs Other Breakout Strategies
| Breakout Strategy | Key Feature | When It Works Best |
| Channel Breakout | Clearly defined parallel boundaries | Ideal for both trend and range traders due to visual clarity and adaptability |
| Triangle Breakout | Converging trendlines | When the market is compressing before a large directional move |
| Bollinger Band Breakout | Volatility contractions and expansions | Best for spotting shifts in volatility-driven markets |
| Support/Resistance Breakout | Horizontal price levels without full channel formation | When price reacts strongly to established support or resistance zones |
Conclusion
Channel breakout strategy is a sure method to trade on powerful price movements following consolidation. High-probability opportunities can be obtained by using disciplined entries and exits, along with the confirmation of breakouts using indicators, and bringing definition to the channels.
The trick is to wait, be patient, and be disciplined in managing risk until a true breakout, supported by both momentum and volume, occurs. Channel breakout strategy can be a good trading tool no matter if you trade forex, stocks, or commodities.
FAQs
The working mechanism of the channel breakout strategy is known to occur when a movement is perceived between two parallel lines in a price behaviour on the chart, indicating support and resistance. The traders observe that the price has to close higher beyond these points to indicate that the previous range has lost hold. When a breakout is initiated, it implies that buyers or sellers have taken control, and in many cases, the direction is continued or followed through. This method is suitable to be use on trending and ranging markets and is appreciated because of its visual clarity and ease of noticing trade setups.
In a trading channel breakout, parallel lines connecting the recent swing lows and swing highs are drawn and tried first. Await confirmation of a breakout above the top line (a bullish breakout) or below the bottom line (a bearish breakout). Validate the relocation by signs that are usually supportive, like a change in volume or momentum that is oscillating. Set your entry direction to the breakout direction, and place a stop-loss slightly inside the channel. This limits the risk and ensures you achieve desired profits based on the channel height or the latest price pattern.
Channel breakouts can be used profitably, depending on how they are approached with the right rules, discipline, and risk management. The traders are good in markets when there is continued strength following a breakout, and you have the ability to ride the trends. But they might trap you in breakout situations that turn out to be false and result in losses. Breakout signals can be combined with confirmation tools, such as volume or momentum indicators, to enhance profitability. It will be necessary to follow a regular use and avoid overtrading.
To validate a channel breakout, it is advisable not to respond to the first price touch beyond the boundary. Rather, wait till a candle closes outside the channel. Seek confirmation by way of superior trading volume, high momentum readings, or agree with higher time frame trends. The chance to be easily fooled by false breakouts is minimised with multiple confirmations. There are traders who wait for the broken level to retest, so that resistance or support becomes the opposite.
The best indicator of channel breakouts does not exist, but some are effective together. Volume can be used as a confirmation indicator, as a breakout followed by higher volume indicates very strong conviction. The direction can be validated using indicators of momentum such as the Relative Strength Index (RSI) or MACD. ATR (Average True Range) can assist in measuring the volatility, and hence it becomes simple to set achievable stop-loss and profit objectives.