It can be hard to tell if a price drop is just a short pause or the start of a bigger fall. Buying during a small bounce often leads to losses if the decline continues. The downside tasuki gap candlestick pattern helps spot such situations. It forms when a downward move is followed by a brief upward candle, which then gets reversed. This pattern shows that sellers are still active. In this blog, we explain what this pattern means, how it forms, and how it’s read on the chart to avoid wrong entries during falling markets.
What is a Downside Tasuki Gap?

A downside tasuki gap is a three-candle bearish continuation price gap pattern seen during falling markets. It shows a price gap down, a brief recovery, and then a return to selling. This structure signals that sellers remain in control despite a short-lived upward move.
How Does a Downside Tasuki Gap Form?
The downside tasuki gap candlestick pattern forms when the price continues falling even after a small upward pause.Its formation includes:
- A strong red candle appears, pushing the price lower.
- The last candle turns bullish and finishes inside the gap zone.
- The third candle is red again, closing below the second one and continuing the downward move.
How to Identify a Downside Tasuki Gap on a Chart
This three-candle pattern appears during a downtrend and can be spotted by checking for gap structure and candle arrangement. The main points to identify the pattern are:
- The market should already be in a downtrend.
- The first candle is bearish, continuing the decline.
- The second candle is also bearish and gaps down from the first.
- The third candle is bullish and closes within the gap.
- This third candle should cover at least half the gap’s body but not fully.
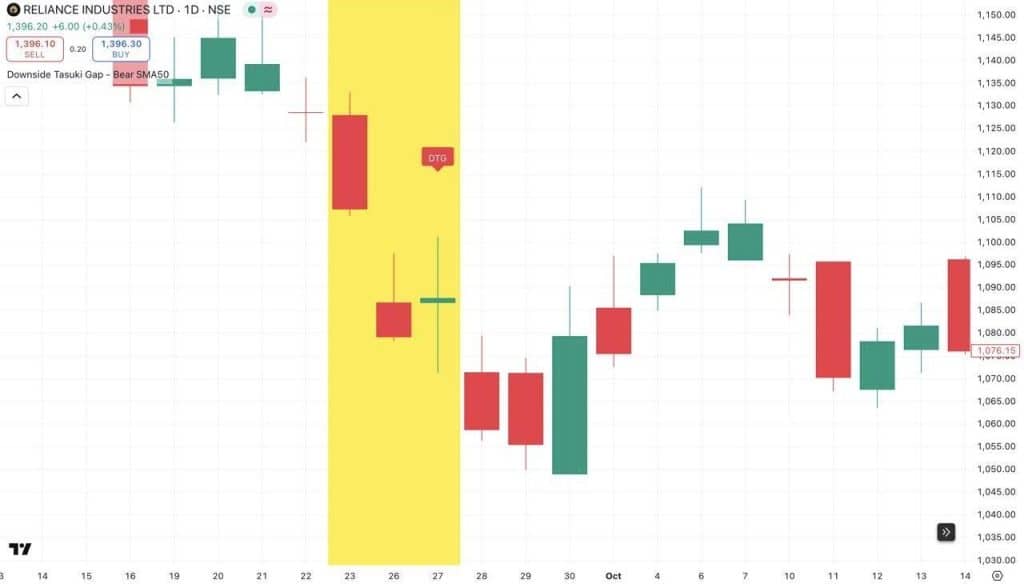
A clear example of this can be seen on the daily chart of Reliance Industries Ltd., where a downside tasuki gap appeared on February 26, 2022. The price gapped down between two red candles, and the next green candle rose but failed to fill the gap, displaying that selling pressure remained active.
Psychology Behind the Downside Tasuki Gap
The downside tasuki gap candlestick pattern shows persistent selling pressure in a falling market. The first candle shows strong control by sellers, followed by a gap down, hinting at deeper weakness. The third green candle fails to reverse the move and gets blocked within the gap. This suggests sellers remain active, keeping the overall market sentiment negative.
How to Trade the Downside Tasuki Gap Pattern
The pattern is usually traded after confirming the complete candle structure and a clear price move. The steps to trade this pattern are as below:
- Identify the pattern: Look for two red candles separated by a gap, then a green candle that partly covers it.
- Wait for confirmation: Check if price closes below the low of the third candle to confirm continuation of price movement.
- Enter the trade: Initiate a short position only after confirmation with a candle closing below the third candle’s low.
- Set a stop-loss: Place the stop-loss slightly above the high of the third candle to reduce exposure to risk.
- Monitor the setup: Track the movement and use a trailing stop if price continues to move further in the same direction.
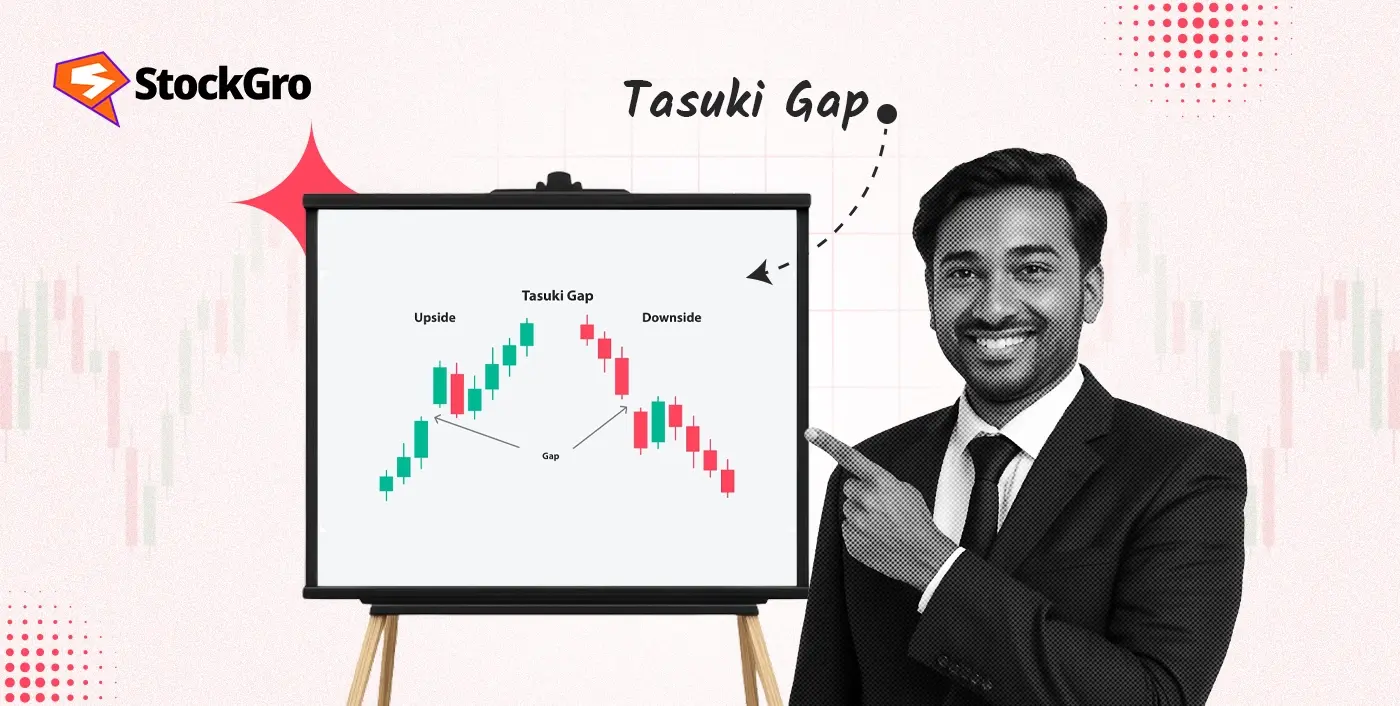
Downside Tasuki Gap vs Upside Tasuki Gap
The downside tasuki gap and upside tasuki gap are opposite patterns. Both show a short pause within a strong move, followed by continuation. They differ mainly in price movement direction and how the candles form. Here’s the core differences among them:
| Feature | Downside tasuki gap | Upside tasuki gap |
| Market direction | Downtrend | Uptrend |
| First candle | Bearish | Bullish |
| Second candle | Bullish (small recovery) | Bearish (minor pullback) |
| Third candle | Bearish (closes below 2nd) | Bullish (closes above 2nd) |
| Signal | Continuation of fall | Continuation of rise |
Confirming the Downside Tasuki Gap with Indicators
Technical indicators can help confirm the validity of the downside tasuki gap candlestick pattern before taking any action. Some of these indicators are as follows:
- RSI: This shows the strength of recent price changes on a scale from 0 to 100. If RSI is below 50 when the pattern appears, it can reinforce the idea of continued bearish movement.
- Volume: Volume analysis tracks how much of an asset is being traded. Increased volume during the gap and confirmation candle can strengthen the pattern’s reliability by showing active selling pressure.
- Exponential moving average: It gives more weight to recent price changes than a simple average. A price closing below a falling EMA line during the pattern helps reinforce the bearish continuation.
Common Mistakes While Trading the Downside Tasuki Gap
Some frequent mistakes made when using the downside tasuki gap candlestick pattern include:
- Not validating the pattern with tools like support-resistance levels or indicators.
- Ignoring key news or data that may impact price.
- Failing to set or manage stop-loss orders.
- Taking too many trades or staying in positions too long.
- Acting too quickly or exiting early.
- Skipping regular trade reviews or strategy updates.
Advantages & Limitations of Using the Downside Tasuki Gap
The downside tasuki gap offers several useful features for traders:
- Helps spot price declines where short positions may be considered.
- The pattern has three clear candles, making it easier to recognize.
- Gives insights into market activity by showing how buyers respond after a gap.
- Can offer timing support for entries during a continued price drop.
Still, a few other drawbacks should also be kept in mind:
- It may produce signals that do not work out, leading to losses.
- Sudden changes in price conditions can interrupt the expected movement.
- It is based on earlier price activity and does not account for new developments.
- Depending only on this pattern may overlook other important signals.
Conclusion
Reading a bounce in a falling market can be tricky. The downside tasuki gap candlestick pattern shows when such a bounce may not last. Its structure points to sellers staying in control. Combining this pattern with other indicators can improve its effectiveness. Like all price patterns, it’s most useful when backed by proper analysis and not used in isolation.
FAQs
A downside tasuki gap occurs when the first candle is bearish, the second opens with a gap down and is also bearish, and the third is bullish but doesn’t close the gap. This means selling pressure is ongoing and the decline may continue.
The downside tasuki gap is bearish. It appears in a downtrend, showing sellers are strong. The pattern suggests more downside, the gap is resistance even after a small up candle tries to fill it.
This pattern is moderately reliable in strong trends but less so in sideways or choppy markets. Use it with other tools, as false signals can occur and its accuracy drops if the market is not trending.
The downside tasuki gap can be found on intraday charts but its signals are more reliable on daily or longer timeframes. On short intervals the pattern is more prone to noise and false moves, so be careful.
Daily or weekly charts are best for downside tasuki gap, as these timeframes remove noise and give more reliable patterns. But some traders use it on hourly charts for shorter term opportunities.