You may have come across words like Dragonfly Doji and Gravestone Doji if you are new to candlestick patterns. They may sound dramatic, but in technical analysis, they are very crucial signals. If you are wondering about where the market might turn, these patterns can help. Let’s break them down in a very easy way so you can grasp what they imply and how to apply them when you trade.
What is a Dragonfly Doji Pattern?
A candlestick pattern that depicts an upward trend on a stock chart and further signals that the trend may change, is referred to as a Dragonfly Doji. It usually shows up near the end of a decline and means that buyers are starting to take charge.
The term comes from the fact that the doji candlestick looks like a dragonfly, with a long tail (or shadow) at the bottom and little to no body or upper shadow.
How is the Dragonfly Doji Formed?
It is created in the following scenarios:
- The prices for opening, closing, and high are almost the same.
- The low is significantly lower, which makes a long shadow below it.
This pattern implies that purchases brought the price back up, almost near the starting price, irrespective of the sellers trying to lower it, during the session.
So, even though there was a lot of pressure to sell, purchasers eventually stepped in.
What is a Gravestone Doji Pattern?
What appears at the top of an upswing and tells you that a change may be coming is referred to as a Gravestone Doji.
This design looks like a gravestone, which is where the name comes from. It has a lengthy upper shadow and nearly no body or bottom shadow.
How is the Gravestone Doji Formed?
It is created in the following scenarios:
- The prices for opening, closing, and low are all very close.
- The high is much higher, which makes a long upper shadow.
This suggests that buyers sought to raise the price during the session, but sellers pushed it back down to the starting level. That’s an indication that the bulls might be running out of steam.
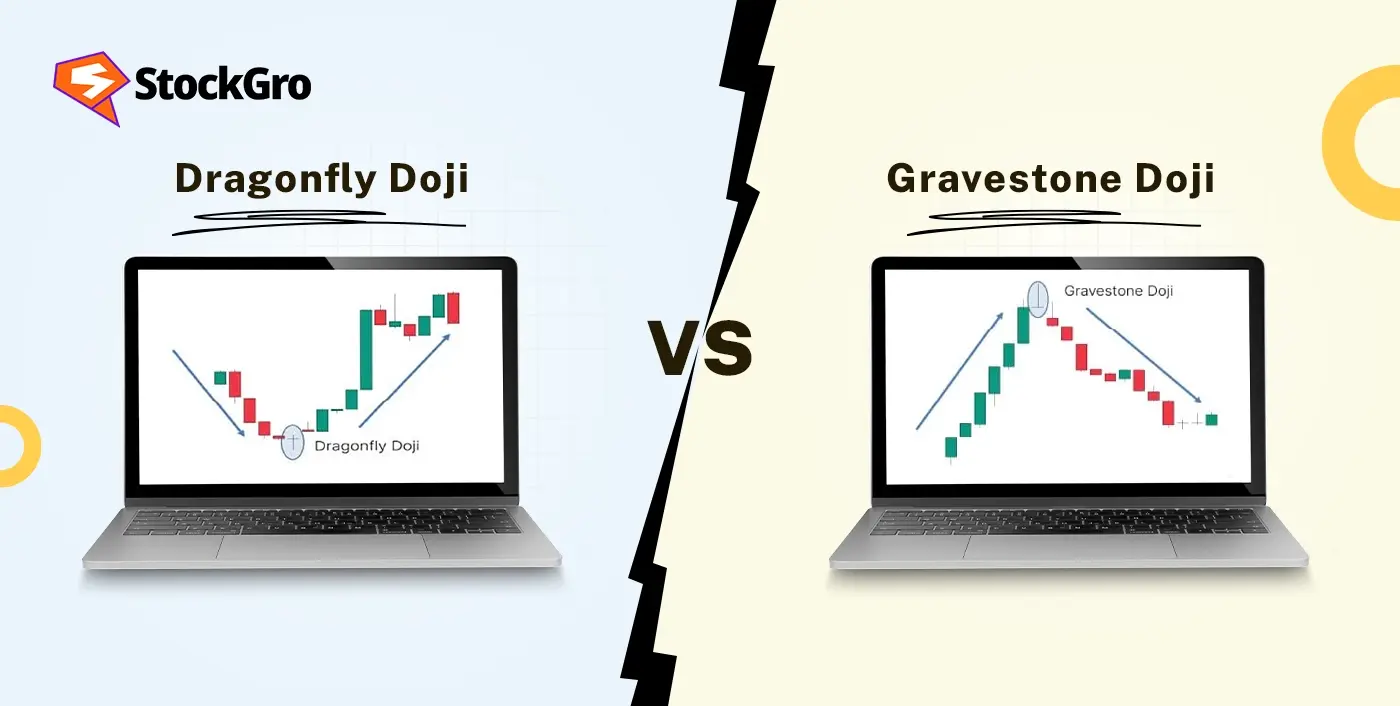
Dragonfly Doji vs Gravestone Doji: Key Differences
Dragonfly Doji and Gravestone Doji may look the same on the outside, yet they show quite different emotions about the market. It’s important to know how they differ so you can read the charts’ tear sheets correctly and make better trading choices. Let’s look at their differences:
| Feature | Dragonfly Doji | Gravestone Doji |
| Shape | It comprises of a long lower shadow but has almost no visible upper shadow or body | Has a lengthy top shadow and nearly no shadow below or body. |
| Appears after | A slump that could lead to a bullish reversal | An upward trend that could imply a bearish reversal |
| Signals | Suggests that selling pressure has reduced, and buying may push prices up | Indicates that buying pressure has faded, and sellers might drive prices down |
| Buyer/Seller Strength | Buyers regained control after heavy selling during the session | Sellers regained control after aggressive buying failed to hold |
| Price Movement During Session | The prices went back up, almost close to the opening price after dropping alot. | Price rose sharply but fell back to the opening price by the session’s end |
How to Trade the Dragonfly Doji Pattern
Trading the Dragonfly Doji is all about waiting for confirmation.
1. Identify the Pattern
Consider looking at the bottom of a downtrend. That’s where the Dragonfly Doji may be visible. It should have a long lower shadow and almost no body.
2. Wait for the Next Candle
Take your time. You can wait to check when there is a close for the next candle above the peak of Dragonfly Doji. That means the trend can change direction.
3. Set Entry, Stop Loss, and Target
- Entry: Enter when it is above the confirmation candle
- Stop Loss: At a lower level than the Dragonfly Doji
- Target: Opt for the most recent resistance levels or use the risk-to-reward ratio for your calculation.
How to Trade the Gravestone Doji Pattern
You need to confirm your move with the Gravestone Doji before proceeding, just like with the Dragonfly.
1. Spot the Pattern
Look for a Gravestone Doji near the top of a trend that is going up. Look for a long upper shadow and a flat body near the low.
2. Wait for a Bearish Candle
To enter, the next candle must close below the Gravestone Doji’s low.
3. Plan Your Trade
- Entry: Below the low of the candle that confirmed it
- Stop Loss: Above the Gravestone Doji’s high
- Target: Use the most recent support levels or the risk-reward ratio you chose.
Best Confirmation Indicators
Adding technical indicators can give you extra confidence before entering a trade based on a Doji.
Volume
- A Doji with high volume adds more weight to the signal
- Low volume? Be cautious, it may be a false signal
RSI (Relative Strength Index)
- Dragonfly Doji + Oversold RSI = Strong bullish reversal signal
- Gravestone Doji + Overbought RSI = Strong bearish reversal signal
Moving Average
- If a Dragonfly Doji appears above the 200-day moving average, it’s stronger
- If a Gravestone Doji appears below the MA, that confirms bearish strength
Limitations of Doji Patterns
Doji patterns are helpful, but they aren’t magic. Please do keep in mind the following points:
1. False Alarms
Even when the market is moving sideways or choppy and there isn’t a definite trend, doji patterns can still show up. In certain situations, they could look like they’re going to go the other way, which might cause false breakouts and signals that don’t make sense.
2. No Volume, No Power
A Doji without strong trading volume behind it is much less reliable. Volume helps confirm whether the reversal indicated by the pattern is backed by real market interest or just a fluke.
3. Needs Confirmation
Even when the market is moving sideways or choppy and there isn’t a definite trend, doji patterns can still show up. In certain situations, they could look like they’re going to go the other way, which might cause false breakouts and signals that don’t make sense.
Related Doji Candlestick Patterns
Want to explore more? Here are some other Doji types you should know about. Each one gives us a slightly different view of how people think about the market:
1. Standard Doji: The opening and closing prices are very similar in this form of Doji pattern, which is the most common. It usually means that the market is unsure, and that buyers and sellers are fighting over who will prevail.
2. Long-Legged Doji: Long legged doji pattern features long shadows on the top and bottom, while the real body is tiny or not there at all. It shows how volatile the market was during the session, when the price went up and down a lot before settling near the open. It shows that people are confused and don’t know what the future holds.
3. Four Price Doji: A highly unusual pattern in which the prices at the open, high, low, and close are identical. Four price doji usually appears in extremely low-volume situations or when there is complete indecision in the market. It’s often seen as a placeholder candle and carries little trading value on its own.
4. Neutral Doji: This pattern happens when the market begins and closes at almost the same level, but the price doesn’t move significantly in either direction. People often see it in sideways or consolidating markets, but it doesn’t give a strong indication on its own.
Conclusion
Doji patterns may not seem important, but they say a lot about how the market is shaping up. These patterns help you see what’s going on beneath the surface, from symptoms of reluctance to hints of a prospective turnaround. Just remember that they shouldn’t be used alone. You will be able to read the charts more clearly and confidently if you use them with powerful confirmation tools. Finding these patterns might become second nature over time.
FAQs
The Dragonfly Doji can show up on any time frame, although it works better on longer ones like daily or weekly charts. The pattern gives stronger indications and cuts out market noise on longer timeframes. If you’re using it on intraday charts, like 15-minute or hourly charts, though, be sure to use it alongside confirmation indicators like volume or RSI. The “best” timeframe for you depends on how you trade, however, higher timeframes are clearer and show bigger trend reversals.
Dragonfly and Gravestone Doji patterns can help you find possible reversals, but how accurate they are, depends on the situation. They perform best when they come after a definite trend and are backed up by additional signs, such as volume surges or RSI divergence. These patterns can sometimes give incorrect indications on their own, especially in markets that are turbulent or moving sideways. So, even though they can be right in some situations, it’s best to think of them as part of a bigger plan.
Most of the time, a Gravestone Doji is thought to be a bearish candlestick pattern. It usually happens near the top of an upswing and means that buyers tried to raise prices but lost control by the end of the session. This could mean that the market is getting weaker and that the trend could change to the downside. Traders, on the other hand, sometimes wait for confirmation from the following candle and examine other indicators, including volume, to make sure that it is accurate. The bearish signal could be wrong if it isn’t confirmed.
Yes, you can utilise the Dragonfly Doji for intraday trading, especially on charts that show 5, 15, or 60 minutes. It can show short-term changes or important turning points during a session. But intraday markets are more unstable, and patterns may form more often, which means there is a bigger chance of false signals. Always use confirmation techniques like volume surges or moving average crossovers with the Dragonfly Doji to make it more accurate. When using it during the day, it’s also important to manage risk and place stop-loss orders correctly.
A Dragonfly Doji has a long lower shadow with little to no upper shadow, showing that sellers pushed the price down but buyers brought it back up near the opening level. It often signals potential bullish reversal.
A Gravestone Doji, on the other hand, has a long upper shadow with little to no lower shadow, indicating that buyers pushed prices up but sellers forced it back down. It is generally seen as a bearish reversal signal.
When a Dragonfly Doji appears at the top of an uptrend, it may signal weakening buying momentum. Although it is usually considered bullish at the bottom of a downtrend, at the top it can indicate indecision and possible trend reversal depending on confirmation from the next candle.
Yes, a Dragonfly Doji is typically considered bullish when it appears after a downtrend. It suggests that buyers have regained control. However, confirmation from the next candle is important before taking a trading decision.