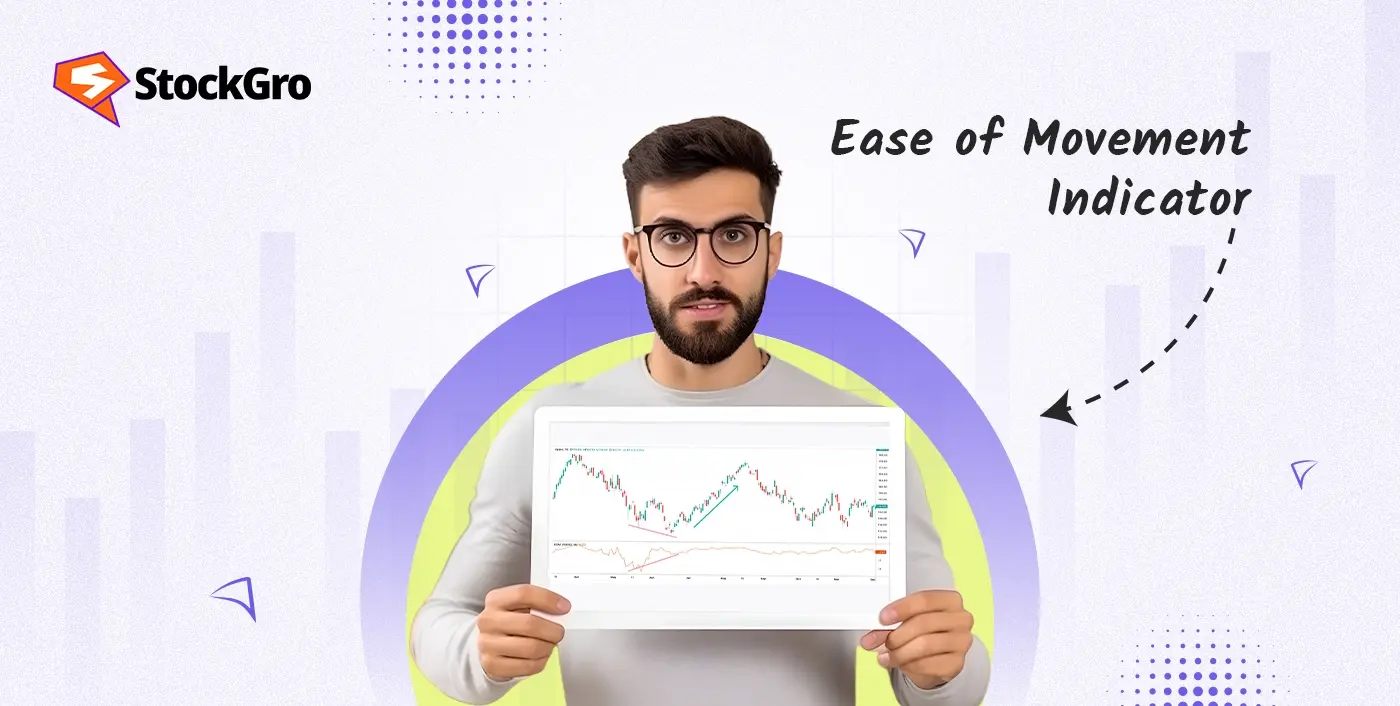
Markets tend to focus on where prices go. But how they get there often says more. Sometimes, a shift happens with real weight behind it. Other times, it drifts with little backing. The Ease of Movement indicator captures that difference. Explore what it tracks, how to interpret the signals and where it adds value in decision-making.
What is the Ease of Movement (EOM) Indicator?
The trading indicator observes how smoothly price travels when compared with trading volume. Acting as an oscillator, it swings between positive and negative values, offering a glimpse into underlying volume and price behaviour. Hence helpful in distinguishing trending markets from those that are consolidating.
Who Developed the Ease of Movement Indicator?
Richard W Arms Jr introduced the Ease of Movement in May 1990 through (Volume 8) of Technical Analysis of Stocks & Commodities. His approach fused volume and momentum into a single, readable measure.
The idea was to observe how freely prices shift without facing resistance from volume pressure. When movement happens with little effort, it may continue in that direction for a tradable period.
How Does the Ease of Movement Indicator Work?
As noted earlier, EOM shows how market level changes based on trading volume. The values move above and below a centre line, helping traders read the pressure behind price direction.
- A positive value appears when price increases noticeably on low volume. This suggests upward movement is occurring with little resistance.
- A negative value forms when price moves very little despite high volume. This can signal underlying pressure or difficulty sustaining a trend.
This contrast helps traders understand whether the current direction has strength or if underlying pressure could affect future moves.
Ease of Movement Formula Explained
The formula for a single period is,
EOM= Midpoint Change / Box Ratio
- Midpoint Change shows how much the average price shifts from one period to the next. It captures the directional movement within a session.
- Box Ratio adjusts that change based on trading volume & price range.
How to Calculate Ease of Movement
Step 1: Calculate the midpoint range
Establish the change in price midpoint between two successive intervals:
C= (Current high + Current low) / 2
P= (Previous high + Previous low) / 2
Midpoint change, MC = C-P
This value shows the direction and size of the price movement between periods. A larger change indicates stronger directional movement.
Step 2: Calculate the box ratio
Determine the box ratio by integrating transaction volume with the daily price spread:
Box ratio, BR = (Volume / Scaling factor) / (Current high − Current low)
Let’s break this down:
- Volume: This is simply how much was traded during the period.
- Price range: The difference between the high and low prices for the current period.
- Scaling factor: A constant (1000-100,000,000 based on a stock’s average daily volume) used to reduce the size of volume data, making the result measurable.
Box ratio contextualises movement. It answers how much trade activity accompanied the price fluctuation within that session.
Step 3: Derive the 1-period EOM
Calculate the unfiltered EOM for a single interval
1-Period EOM = MC/ BR
This shows how much price is moving in relation to the effort required to move it.
Step 4: Smooth the indicator with a moving average
To reduce short-term volatility, the 1-period EOM values are averaged across a chosen period.
A 14-period simple moving average is commonly used:
14-Period EOM = Average of 14 recent 1-Period EOM values
This step suppresses short-term irregularities and exposes underlying directional patterns
How to Interpret the Ease of Movement Indicator
EOM examines how effortlessly an asset moves when compared with market activity.
- If the value is large, it means the price moved easily, with little volume or resistance. Pointing to possible upward trend.
- If it’s small, then more volume was needed to push the price even a small amount, suggesting stronger resistance or weaker momentum.
- Values near zero reflect reduced activity and an evenly matched market. This often appears when neither side holds momentum or clear intent.
How to Use Ease of Movement for Trading
Applied carefully in technical analysis, it highlights whether market pressure is supporting or resisting current bias. Here’s how:
- Evaluating trend conditions: Sustained values above the baseline can indicate that price is climbing with minimal volume weight. Extended placement below that level may reflect a decline progressing with little opposing activity.
- Spotting possible turns: A shift from below to above the zero line may indicate the start of upward momentum. Likewise, dropping from strength into negative territory may suggest weakening conviction or developing downside pressure.
- Supporting breakout assessment: If the EOM value rises sharply during a breakout, it may reflect reduced opposition and support the price move. This can help distinguish between strong breakouts and those lacking follow-through.
- Avoiding indecisive phases: When values cluster near the midpoint, it often signals uncertainty or short-term balance between participants. In such cases, the indicator can help filter out low-quality entry points during unclear conditions.
Ease of Movement Indicator Settings
The tool includes two main inputs that influence its function:
- Calculation period: This input sets how many bars or candles are used to generate the values. A narrower scope may catch short-term moves but can introduce irregularities. Longer ones react slowly but help smooth out noise.
- Smoothing value: This adjusts how raw figures are smoothed over time. It defaults to 14 in most platforms.
Ease of Movement Trading Strategies
EOM offers insight into how price reacts to volume flow. On its own, it highlights how effortlessly a market adjusts. Within a strategy, it becomes more meaningful when interpreted in context.
- Use a moving average as a signal line: Placing a moving average on the EOM line may help identify directional bias. A rise above it could mark renewed strength. A move below may reflect softening intent.
- Watch for divergence with price: Watch for divergence between EOM and price. If the price is rising but the EOM is falling, it may hint at slowing momentum. Conversely, rising EOM with flat prices can signal a potential breakout.
- Pair with complementary indicators: Combining EOM with tools like RSI or MACD can bring structure to decision-making.
Advantages of Ease of Movement Indicator
- Rather than focusing solely on where price moves, it reflects how much activity is required to drive that movement.
- The central level acts as a baseline. When values remain above it, upward momentum is suggested. Below it, fading interest may be inferred.
- Its structure remains consistent across equities, currencies or commodities, with no major adjustments required between asset types.
- Applying an average to the output can help manage short-term fluctuations, supporting longer-range pattern recognition.
Limitations of Ease of Movement Indicator
- As a lagging measure, it reflects rather than anticipates price action. This delay can cause late entries or exits in fast-moving conditions.
- In sessions marked by inconsistent flow or reduced conviction, the reading may highlight noise rather than structure.
- On its own, the measure may miss developments outside volume-pressure patterns. Integrating it with other techniques strengthens interpretation.
FAQs
It reflects how easily price shifts in relation to traded volume. The line moves above or below a central level. Higher values may suggest upward movement with limited resistance. Lower readings can point to selling pressure or reduced demand.
It reflects volume-backed movement but does not always give early cues. Some conditions make it more responsive than others. Sharp reversals or sideways phases may reduce its clarity. It may work better when paired with other tools.
It depends on the style of trading. Short intervals may highlight brief shifts but can introduce noise. While longer charts tend to smooth fluctuations and filter minor changes. Neither approach suits every asset equally. The setting should match the strategy.
It reacts to past price and volume data, hence a lagging indicator. The reading often follows established movement rather than anticipate it. That may limit its timing in fast markets.
It can be applied to shorter timeframes, but results may vary. In fast sessions with strong volume, it may respond clearly. But during quieter periods, the output can become less stable. For better clarity, it is often combined with additional filters.
There is no universal input that fits every method. The smoothing value is often set to 14, offering a balance between responsiveness and stability. Lower values may highlight short-term shifts but can introduce noise. Higher ones reduce irregular movement but may respond more slowly.

