Ever entered a trade after a breakout, only to see the price snap back and hit your stop loss? You may have witnessed a false breakout. In this article, we’ll explore how fake breakouts work, why they happen, and how to trade them smartly.
What is a Fake Breakout?
A fake breakout occurs when the asset price fails to move beyond a significant support or resistance level and instead reverses to the previous range.
This move often triggers traders who follow breakout strategies. They jump in thinking a trend is starting. But then the price reverses and traps them, usually leading to losses.
The Fake or False breakouts emerge in markets with thin volume or during episodes of heightened volatility. They can shake out weak hands and try your patience. However, with a clear understanding of their mechanics, they might present a chance instead of a trap.
How Do Fake Breakouts Happen?
Here’s how a typical false breakout plays out:
- The market advances toward a key support or resistance level.
- It briefly moves beyond it, making it look like a breakout.
- Traders enter the trade, expecting a continuation.
- But the price reverses, heading back into the previous range.
- Stop losses get hit, and liquidity is created for larger players.
Types of Fake Breakouts
False breakouts can happen at both support and resistance levels.
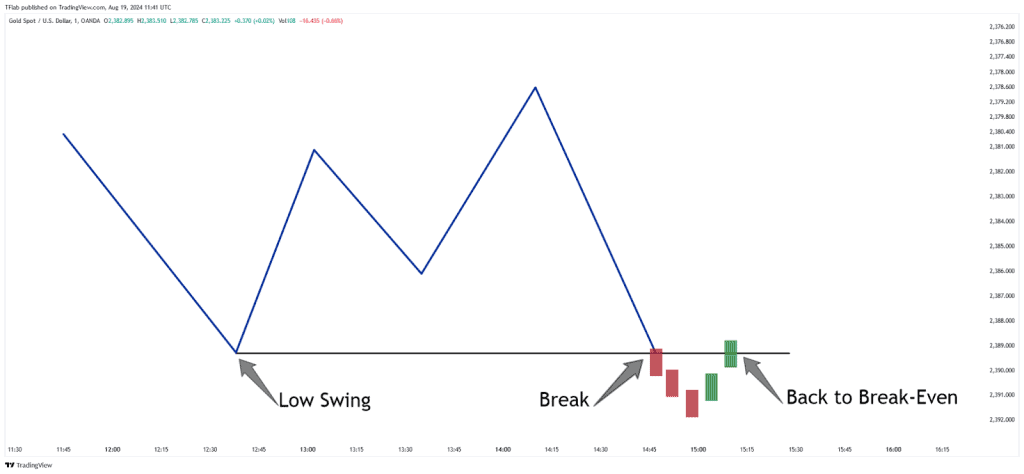
False Breakout at Support
Let’s say a stock is hovering around ₹150, a known support level. One day, it drops to ₹147, making traders believe the support is broken. But then, it quickly bounces back to ₹151. This was a false breakout below support.
These often happen when sellers try to push the price lower, only to get overwhelmed by buying interest.
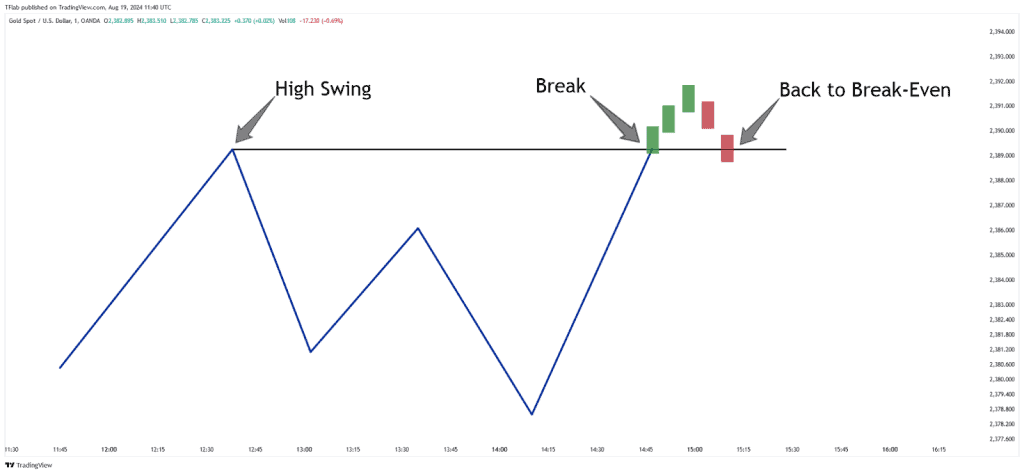
False Breakout at Resistance
Now, imagine a stock struggling to cross ₹200. In one session, it jumps to ₹205, signaling a breakout. Traders jump in. But within hours, the price falls back to ₹198. That spike was a fake breakout above resistance.
It is a classic trap. Smart money sells into the rally while individual traders get exposed on the wrong side.
Why Do Fake Breakouts Occur?
There are a few key reasons:
- Lack of Volume: Price moves without strong participation. Without volume support, breakouts often fail.
- Market Manipulation: Big players may push prices beyond a level to trigger orders, then reverse them.
- News Traps: Headlines or events cause sharp moves that don’t last.
- Retail Panic: Emotional trading and FOMO (fear of missing out) lead to impulsive entries.
Often, these breakouts are designed to trigger stop losses or invite liquidity into the market before a real move begins.
How to Identify a Fake Breakout
Catching fake breakouts in real time isn’t easy, but certain signs help. This is where technical analysis becomes especially useful; it enables you to look beyond the surface and assess the strength behind price moves.
Volume Analysis for Fake Breakouts
A true breakout often comes with high volume. If price breaks a key level but volume is low, be cautious. It might be a false move.
Also, watch for volume divergence. If the priceascends but volume is declining, the momentum may lack genuine strength.
Candlestick Confirmation
Price action tells a lot. Some common candlestick signs of a fake breakout:
- Pin bars: Long wicks beyond support/resistance, showing rejection.
- Bearish engulfing (at fake resistance breakout).
- Bullish engulfing (at fake support breakdown).
- Quick reversal candles right after the breakout.
If the breakout candle is small, weak, or quickly reversed by a stronger candle, take a step back.
Fake Breakout Trading Strategies
Instead of fearing fake breakouts, you can trade them. Here’s how.
Fade the Fake Breakout
This strategy means trading against the breakout after it fails.
Steps:
- Wait for the price to break a key level.
- Don’t enter immediately, give it time.
- Watch for reversal signs like pin bars or volume drop.
- Enter in the opposite direction of the breakout.
- Set a tight stop loss just outside the recent high or low.
For example, if price falsely breaks ₹200 resistance and then closes below it with a bearish candle, you can short with a stop above ₹205.
This approach works well in range-bound markets.
Using Stop Loss for Fake Breakout
If you are trading breakouts, protect yourself:
- Don’t place your stop loss right near the breakout point.
- Place it beyond the “trap” zone, so you don’t get stopped out in a fake move.
- Use ATR (Average True Range) to measure how far the price can swing before it reverses.
Also, avoid over-leveraging. Small losses from fake breakouts are okay. Large losses can hurt your account.
Tips to Avoid Fake Breakouts
Here are some practical ways to stay safe:
- Wait for a close: Don’t jump in the moment the price crosses a level. Wait for a candle to close beyond it.
- Check volume: Low volume breakouts are less reliable.
- Use confirmation indicators: You can use RSI, MACD, or moving averages to confirm the move.
- Trade in the direction of the trend: Breakouts that go in the same direction as the larger trend are more likely to work.
- Zoom out: Check higher timeframes to see if the breakout level is significant or just noise.
Patience is your edge. The best setups take time to form.
Conclusion
A fake breakout can trick traders into thinking a new trend is emerging, only to have it turn around soon. It is why you need to be careful when you observe these moves. They frequently occur on low volume and can be spotted by price action and candlestick signs.
It is not always easy to forecast, but using volume analysis, chart patterns, and good trading tactics together can help you avoid losing money. Knowing how to spot and deal with fake breakouts makes your trading more interesting and gives you more confidence when dealing with market behaviour.
FAQs
A false breakout in trading happens when the price moves above resistance or below support but doesn’t continue in that direction. Instead, it quickly reverses, trapping traders who entered early, and goes back into the previous price range.
To avoid getting trapped in fake breakouts, wait for the candle to close beyond the level, check if volume is strong, and look for confirmation with price patterns or indicators. Don’t rush in; let the market show clear direction first.
To trade fake breakouts, wait for the price to break a level and then quickly return. Enter in the opposite direction after a clear reversal signal. Use a tight stop-loss and check volume and candle patterns for better confirmation before entering.
Low volume, abrupt news, or major players hitting stop losses can all produce fake breakouts in equities. These moves can fool traders into getting in early, just to have the price go back to its original range.
You can tell if a breakout is fake by looking at the volume and the patterns of the candlesticks. It could be false if the breakout occurred on little volume or swiftly turns around with heavy rejection candles. Waiting for a candle to close beyond the level helps avoid traps.