
When a stock crashes after news like weak earnings or a regulatory setback, buyers often step in and create a tidy upward channel that looks like a clean recovery. Many traders get trapped in this phase, entering too early and watching the price collapse again. This is where the inverted flag pattern helps. It shows how these brief pullbacks can simply be pauses in a larger decline, with the steep fall forming the flagpole and the controlled rise shaping the flag. This blog discusses the rules, targets, and more to understand the working of this pattern in detail.
What is an Inverted Flag Pattern?
The inverted flag pattern, often referred to as a bear flag, is a technical chart formation that signals a continuation of an existing downtrend. It emerges once the market has fallen rapidly(flagpole) and then settles into a tight channel, where the price inches upward or stays flat for a short duration. This pattern suggests that selling pressure remains dominant, and the temporary pause is likely to resolve with a further drop in price once the lower boundary is breached.
How to Identify an Inverted Flag Pattern
Identifying the inverted flag pattern requires observing specific price movements and structural elements on a chart. The formation is distinct and includes key components such as:
- Anatomy: flagpole, parallel channel, volume behaviour
The structure begins with the flagpole, which is a steep, almost vertical price decline, indicating strong selling pressure. This initial move separates the inverted flag from other consolidation patterns. Following the pole, the price enters a parallel channel or the “flag” body. This channel typically slopes upward, moving against the primary trend, and represents a pause or consolidation where buyers attempt to push prices up, but sellers remain dominant.
Volume behaviour is crucial for validation; volume should be high during the flagpole formation, decrease significantly during the consolidation (flag) phase, and spike again upon the breakdown.
- Drawing rules (trendlines, slope, channel touches)
To correctly draw the pattern, analysts apply specific technical rules. Trendlines are drawn connecting the highs and lows of the consolidation phase; these lines should be parallel to each other. The slope of these trendlines is vital; it must tilt upward in an inverted flag, contrasting with the preceding downtrend.
A valid pattern typically requires at least two distinct channel touches on both the upper and lower trendlines, confirming the boundaries of the consolidation before the price eventually breaks below the lower support line.
Characteristics of the Inverted Flag Pattern
The inverted flag pattern exhibits distinct behaviours and market psychology traits that differentiate it from reversal patterns. Key characteristics observed during its formation are as follows:
- Prevailing downtrend: The pattern does not form in isolation; it must be preceded by a clear and sharp downtrend. The existence of a prior bearish trend is a prerequisite for the validity of the pattern as a continuation signal.
- Consolidation phase: The flag portion represents a period of market indecision or profit-taking by short sellers. Any bounce during this phase is generally shallow and supported by low volume, revealing minimal enthusiasm from buyers.
- Duration: This pattern is generally a short-term formation. The consolidation period generally extends from short multi-day pauses to brief multi-week stretches. If the consolidation extends too long, the pattern may lose its validity or morph into a different structure, such as a rectangle or channel.
- Breakdown signal: The signal is considered complete once a closing price falls clearly below the lower edge of the flag. This breakdown signals that the bears have regained control and the next leg of the downtrend has begun.
- Price target: The projected price movement following the breakdown is often equal to the length of the flagpole. This “measured move” provides a theoretical target for the subsequent decline.
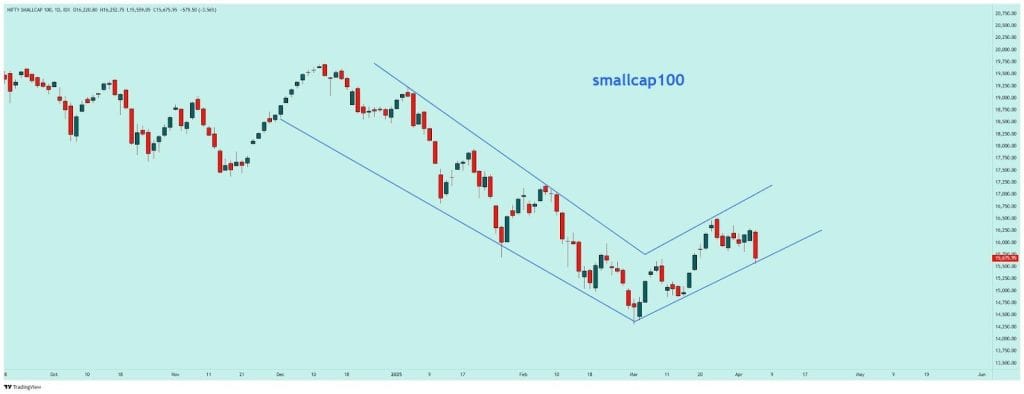
For a clear example, refer to the Nifty Smallcap 100 chart below. It displays a steep price drop ending in early March 2025, which creates the pole. This is immediately followed by a rising channel throughout March and April 2025, forming the classic inverted flag shape.
Types of Flag Patterns
While the inverted flag is a specific bearish formation, it belongs to a broader family of flag patterns used in technical analysis. The primary variations of flag patterns which traders frequently encounter include:
- Bear flag (Inverted flag)
As described, this pattern forms in a downtrend. It features a sharp drop (pole) followed by a counter-trend upward consolidation (flag). The setup points toward an ongoing continuation of the price decline. It is the exact inverse of the bull flag.
- Bull flag
This is the bullish counterpart to the inverted flag. It forms during an uptrend and is characterised by a sharp price rally (pole) followed by a downward-sloping consolidation channel. A move above the flag’s upper line typically marks the start of another upward course.
- High and tight flag
This is a rare but powerful variation, usually seen in strong uptrends (or downtrends for the inverted version). In this type, the pole is extremely steep, and the flag is tight and short, often drifting sideways rather than sloping against the trend. This indicates immense momentum and often precedes a violent continuation move.
- Pennant
While technically distinct, pennants are often grouped with flags. The main difference is the shape of the consolidation; while flags have parallel trendlines (rectangular), pennants have converging trendlines (triangular). However, the implications for continuation are similar for both patterns.
Inverted Flag pattern Confirmation Indicators: volume, EMA trend, RSI/MACD
For the purpose of increasing the reliability of the inverted flag pattern, analysts often look for secondary signals beyond price action alone. These confirmation indicators help validate the strength of the breakout and are as follows:
- Volume profile: Volume is the primary confirmation tool. During the formation of the flagpole, the volume should be expanding. As the price consolidates into the flag, volume is expected to diminish or “dry up,” reflecting weak buying interest. The most critical signal occurs at the breakout; a sharp increase in volume as the price breaches the lower trendline confirms the validity of the bearish continuation.
- Exponential moving averages (EMA): Trend-following indicators like the 20-period or 50-period EMA are often used. In a valid inverted flag, the price typically stays below these key moving averages. The EMAs may also act as dynamic resistance along the upper boundary of the flag. A rejection from the 20 EMA or 50 EMA coinciding with the breakdown adds weight to the bearish signal.
- Relative strength index (RSI): The RSI indicator helps figure out momentum. During the flagpole drop, RSI often reaches oversold levels (below 30). As the flag forms, RSI may rise slightly but should ideally remain below 50 or 60 in a strong downtrend. If the RSI fails to break above the median line during the consolidation, it indicates that bearish momentum remains intact.
- MACD (moving average convergence divergence): The MACD indicator can show a lack of bullish conviction. Even if the MACD lines cross upward slightly during the consolidation (a minor bullish crossover), they often remain below the zero line. A subsequent bearish crossover or a failure to cross the zero line supports the likelihood of a breakdown.
To distinguish high-probability setups from potential failures, traders utilise specific filters and context markers. These validation methods are as follows:
Avoiding false breaks (ATR filter, S/R context)
A false breakout takes place when the price momentarily pierces the trendline but fails to sustain momentum, trapping traders. Techniques to filter these misleading signals include:
- ATR filter: The Average True Range (ATR) indicator measures market volatility. To avoid “noise,” traders may require the breakout candle to close below the trendline by a specific margin, such as 1x ATR. If the price merely wicks below the line without covering this distance, the breakout might be deemed insignificant.
- Support/resistance (S/R) context: Analysing where the pattern forms relative to key levels is critical. If the breakdown occurs directly into a major historical support zone, the probability of a bounce (false break) increases. A valid setup usually requires “room to fall” before the next significant support level is reached.
- Retest confirmation: Conservative strategies often wait for a “retest.” After the initial breakdown, the price may rally back to touch the broken trendline (now acting as resistance). A rejection at this level confirms the validity of the break.
Inverted flag vs descending channel vs pennant
While these patterns share bearish features, the pennant pattern and others vary majorly in structure and duration, as outlined in the comparison below:
| Feature | Inverted flag | Descending channel | Pennant |
| Visual shape | Rectangular “flag” shape formed by parallel lines. | Broad rectangular structure with smooth parallel lines. | Compact triangular structure with converging lines meeting at an apex. |
| Slope direction | Slopes upward, moving against the broader downtrend. | Slopes downward, moving with the overall trend. | Moves mostly sideways with no clear upward or downward tilt. |
| Duration | Short-term formation (1–3 weeks), acting as a brief pause. | Medium to long-term formation (weeks to months) representing the trend itself. | Short-term pattern (1–3 weeks) with a tighter, narrowing range. |
| Trend implication | Continuation pattern signalling the downtrend’s resumption after consolidation. | Represents the structure of the downtrend, not just a pause within it. | Continuation pattern that often leads to a sharp breakdown. |
| Volume behaviour | Strong volume on the pole, lighter during the pullback, stronger on breakdown. | Volume swings rhythmically with price within the channel. | Heavy volume on the pole, fading during the formation, surging sharply at breakdown. |
Inverted flag vs bullish flag: quick comparison
The bullish flag and inverted flag patterns are mirror images of each other, representing opposite market positions, with core differences detailed in the following table:
| Feature | Inverted flag (Bear flag) | Bullish flag |
| Primary trend | Forms during a confirmed downtrend. | Forms during a confirmed uptrend. |
| Pole formation | Driven by a sharp vertical price drop, showing strong selling. | Driven by a sharp vertical price ris,e showing strong buying. |
| Consolidation slope | Slopes upward, showing weaker buying within a decline. | Slopes downward, showing weaker selling within a rise. |
| Breakout signal | The signal becomes official when the market pushes decisively below the lower limit. | A move through the upper edge verifies the breakout. |
| Market psychology | Sellers pause briefly while buyers lack strength. | Buyers pause briefly while sellers lack strength. |
| Price target | Calculated downward, equal to the pole’s height. | Calculated upward, equal to the pole’s height. |
Conclusion
The inverted flag pattern serves as a helpful technical marker for a temporary pause within a broader downtrend. By spotting this specific formation early, traders can better foresee where the selling pressure might resume. This helps in aligning with the market’s direction without guessing, ensuring that decisions are based on confirmed chart structure rather than impulse.
FAQ‘s
The inverted flag pattern is a bearish continuation pattern appearing after a sharp drop (flagpole), followed by a brief consolidation phase where the price moves slightly upward in a parallel channel. It signals a likely continuation of the downtrend after breaking below the flag’s lower trendline.
Traders enter a short position when the price breaks decisively below the lower boundary of the consolidation channel, ideally on high volume, confirming the breakout. A stop-loss is placed above the upper flag trendline to limit losses in case of a false breakout.
Price targets are set by measuring the length of the initial sharp decline (flagpole) and projecting that same distance downward from the breakout point below the consolidation. This “measured move” helps establish realistic profit-taking levels aligned with pattern expectations.
The inverted flag is considered reliable on intraday charts in strong downtrends, especially when volume and indicators confirm the breakout. However, it requires precise risk management as short-term noise can cause false breakouts or quick reversals.
Both indicate bearish continuation; the inverted flag has parallel upward-sloping trendlines forming the consolidation channel, while a bearish pennant features converging trendlines creating a triangular shape. Flag formations often last longer and signal steady pauses, pennants generally imply tighter consolidation.
The inverted flag pattern is effective across timeframes from intraday (15-min, 1-hour) to daily charts. Longer timeframes like daily or weekly provide stronger signals due to clearer trend context and reliable breakouts, while shorter timeframes require more cautious validation.