If you have ever stared at a stock chart wondering whether the latest price jump is real or just noise, you are not alone. For young traders, figuring out market momentum can feel tricky. That’s where indicators like the Klinger Volume Oscillator (KVO) come in.
Think of KVO as a tool that tries to read the “mood” of the market by studying both price movement and trading volume. It can help you see trends sooner and choose whether to follow them or stay away from them.
What is the Klinger Volume Oscillator?
The Klinger Volume Oscillator is a technical analysis tool designed to assess strength and direction of price reversals by analyzing volume and price. It does this by comparing the flow of volume to price trends over time.
In other words, it shows whether money is steadily entering into a stock (buying pressure) or leaving it (selling pressure). This is useful for detecting long-term trends while still being able to see short-term changes.
History and Origin of the KVO
The KVO was developed by Stephen J. Klinger in the late 1990s. His goal was to create an indicator that could link volume to price in a more accurate way than existing tools.
Klinger believed that volume is the “fuel” behind market moves. If you can understand whether the fuel is being added or removed, you can guess where the vehicle (the price) might go next.
How the Klinger Volume Oscillator Works
The Klinger Volume Oscillator (KVO) compares price movement with trading volume to show money flow trends. It uses two exponential moving averages (EMAs) of a calculated value called Volume Force, usually a 34-period EMA (short) and a 55-period EMA (long).
When the short EMA goes over the long EMA, it means that there is buying pressure and a likely rally. When the long EMA goes above the short EMA, it means that selling pressure is stronger, which suggests a downturn. The KVO line goes above or below zero to represent changes in momentum. This helps traders see how things are changing over time and in the short term.
KVO Formula Explained
The Klinger Volume Oscillator is calculated through several steps centred around a key metric called Volume Force (VF). This metric blends volume, price trends, and volatility to reflect the true ‘force’ behind market moves.
- Volume Force (VF) calculation:
Volume Force (VF) = Volume × Trend × Temp × 100
- Volume: Total traded units in the period.
- Trend: +1 for an uptrend, -1 for a downtrend.
- Temp: A price volatility adjustment based on highs and lows.
- Exponential Moving Averages of VF:
Two EMAs are calculated from the Volume Force:
- A short-term EMA, usually over 34 periods.
- A long-term EMA, typically over 55 periods.
- Calculating the KVO:
KVO = Short-term EMA of VF – Long-term EMA of VF
- Signal Line:
A 13-period EMA of the KVO itself acts as a signal line to smooth out fluctuations and generate clearer trade signals. Traders generally look for times when the KVO and this signal line intersect.
This technique lets the KVO smartly blend price and volume data, giving traders a more detailed picture of market momentum than just looking at price or volume trends. It helps you tell when the volume is supporting a trend or warning you that it might change.
KVO vs Other Volume Indicators
| Indicator | How It Works | Strengths | Weaknesses | Best Use Case |
| Klinger Volume Oscillator (KVO) | Look at how volume changes over time and how prices move. Uses a signal line for entries. | Balances short-term and long-term signals; good for spotting early trend changes. | Can give false signals in sideways markets. | Confirming the direction of a trend and finding reversals. |
| On-Balance Volume (OBV) | Adds volume on days when the market goes up and takes it away on days when it goes down. | Very basic and easy to understand. | Too sensitive to slight price fluctuations; can be noisy. | Quick view of volume flow without complex calculations. |
| Chaikin Oscillator | It uses an accumulation/distribution line based on price and volume and compares averages over short and long periods of time. | Good for detecting buying/selling pressure shifts. | Can be harder to interpret for beginners. | Spotting momentum shifts before price changes. |
How to Use the Klinger Volume Oscillator in Trading
The Klinger Volume Oscillator isn’t just for long-term analysis, it can be equally useful for intraday trading. By combining price and volume data, it helps traders spot momentum shifts early and plan entries or exits with more confidence. Below are a few effective ways to use it:
Sub: Identifying Trend Direction with KVO
A strong uptrend is when the KVO line stays above zero and the price keeps going higher. This can help you figure out if a breakout is real when you are trading during the day.
Similarly, if the KVO stays below zero while prices keep falling, the downtrend is likely strong. Avoid buying dips in such cases unless there’s a clear reversal signal.
Sub: Spotting Divergences with KVO
A divergence happens when the KVO and price move in opposite directions. For example:
- Price makes a new high, but KVO doesn’t → could be a sign the trend is weakening.
- Price makes a new low, but KVO rises → could mean buyers are stepping in quietly.
Finding these early can help you in both short-term and long-term trades.
Best Settings for KVO
Most traders employ a slow moving average of 34 periods, a fast moving average of 55 periods, and a warning line of 13 periods by default.
You can change these to fit your style:
- Shorter periods for quick intraday trades.
- Longer periods for swing or position trading.
Before using your settings in real trading, always backtest them.
Limitations of the Klinger Volume Oscillator
Like any indicator, KVO isn’t perfect.
- It can give false signals in choppy markets.
- It works better when paired with other indicators like RSI or MACD.
- Volume data can sometimes be misleading in illiquid stocks.
In short: don’t treat it as a crystal ball, use it as part of a bigger strategy.
Klinger Volume Oscillator: Practical Trading Strategy Examples
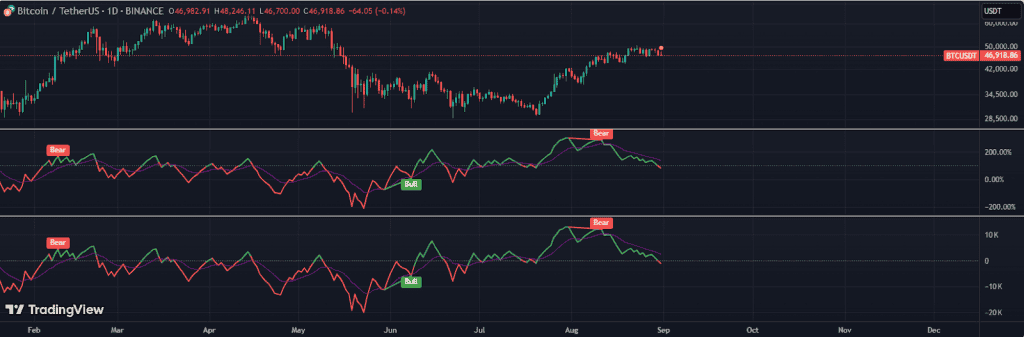
The Klinger Volume Oscillator (KVO) blends price and volume to track market momentum. Here are five practical ways to use it, with suggestions for TradingView chart examples you can attach for better understanding.
- Crossovers:
Watch for when the KVO line crosses its signal line (13 EMA).
- Buy: KVO crosses above → buying pressure building.
- Sell: KVO crosses below → selling pressure increasing.
- Divergence:
Signals early reversals when KVO and price disagree.
- Bullish divergence: Price lower low, KVO higher low.
- Bearish divergence: Price higher high, KVO lower high.
- Zero Line Crossings:
The zero level acts as a momentum filter.
- Above zero means bullish strength.
- Below zero means bearish bias.
Conclusion
The Klinger Volume Oscillator might sound technical, but once you break it down, it is simply a way of reading the balance between buying and selling pressure.
KVO can be a great tool for learning how volume shapes price moves. Just keep in mind that it works best when you utilise it with other indicators, manage your risks well, and have a clear plan.
FAQs
The Klinger Volume Oscillator shows whether buying or selling pressure is stronger in a stock. When it’s above zero, buyers are in control. When it drops below zero, sellers take over. It helps traders figure out how the market feels and what might happen next.
Indicators like the Relative Strength Index (RSI), Moving Average Convergence Divergence (MACD), or basic moving averages function well with KVO. These combinations assist confirm signals, get rid of noise, and make things more accurate in diverse market conditions.
Most traders use the default settings, which are 34 for the slow moving average, 55 for the rapid moving average, and 13 for the signal line. These settings are good for a lot of stocks, but you can change them to fit your trading style.
You can utilise KVO for intraday trading by using shorter time frames, like 5-minute or 15-minute charts. It can help you see quick changes in trends, but always check with other indicators before making trades.
KVO is often more detailed than OBV because it balances short-term and long-term volume trends. OBV is simpler but can be too sensitive to small moves. KVO may give fewer false signals, especially when confirming trends, but neither is perfect.