Jumping into the markets without a system often leads to impulsive trades and inconsistent results. Which is why many traders turn to technical analysis as a more consistent way to read price action. In fact, it’s not just retail traders, 87% of global fund managers use it, and nearly 1 in 5 even prioritise it over other methods. By studying price charts, patterns, and indicators, technical analysis helps traders understand market behavior more clearly. In this blog, we’ll discuss what technical analysis is, the main indicators used, the benefits it offers and more.
What is Technical Analysis
Technical analysis has been around for centuries, with early forms developed by Munehisa Homma in 18th-century Japan and later shaped by Dow Theory in the West. It is an approach that studies price along with volume figures to interpret how markets behave. Instead of looking at a company’s financials or the broader economy, it focuses on how prices have moved in the past.
The idea is that everything known such as news, fundamentals, or sentiment is already reflected in the price. Analysts use this method to study how buying and selling forces play out over time, hoping to spot signs of when price direction might change. It’s widely used across markets including stocks, forex, and commodities.
Use of Technical Analysis
Technical analysis plays an important role in evaluating stock market behavior, especially among short-term participants involved in intraday trading who aim to benefit from price movements. It often includes studying chart patterns like the candlestick pattern to interpret market activity. Below are the primary ways in which it is used:
- Technical Analysis Indicators
Technical indicators are tools based on price, volume, or volatility data that help simplify market behavior into visual signals. These tools help simplify data and offer a clearer view of price conditions. Each indicator serves a different purpose. Broadly, they are grouped into four types:
- Trend indicators like moving averages help track the general direction of price over time.
- Momentum indicators such as RSI or MACD measure the pace of price movements.
- Volume indicators highlight the intensity of participation during price moves.
- Volatility indicators like bollinger bands reflect how much price deviates from its average.
- Trend Lines

Trend lines are straight lines sketched on price charts, linking multiple higher lows or lower highs. When drawn correctly, it visually outlines whether price is moving upward or downward. These lines help identify the direction and slope of price moves and can also signal where price might pause or reverse. Many use them to define dynamic areas where buying or selling pressure has repeatedly entered the market. A price move breaking through a well-established trend line can be a sign that price behavior is changing or losing direction.
- Support and Resistance

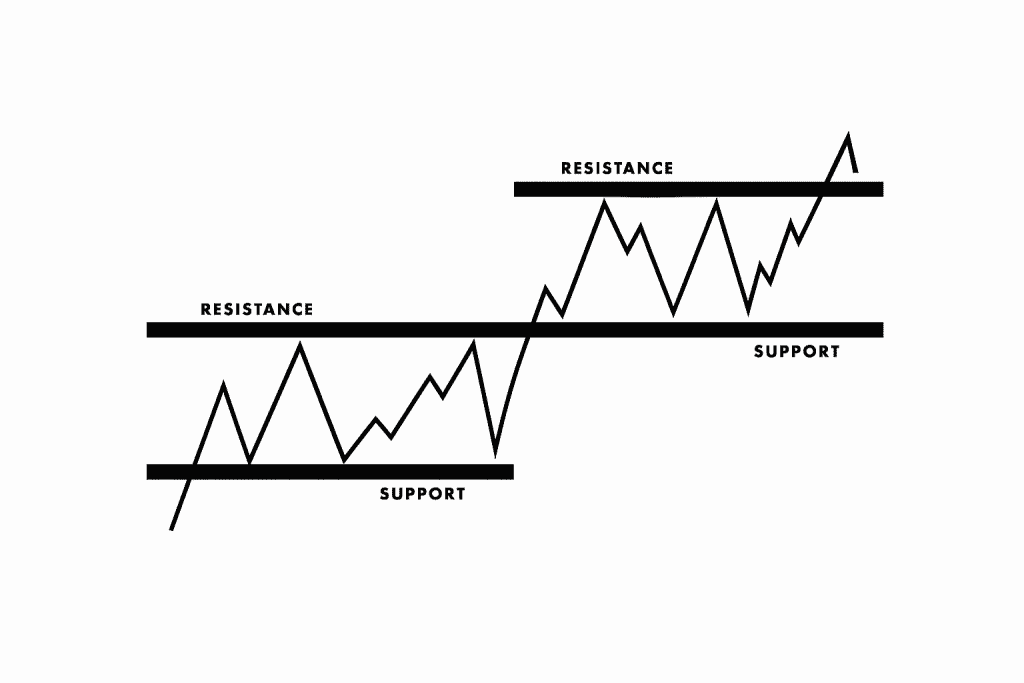
Support and resistance highlight the certain price points where the market has consistently responded.
Support is a level where buying interest tends to appear, preventing price from falling further. Resistance shows a level point where sellers typically step in, preventing further upward movement. These zones are not fixed numbers but are based on previous price behavior. They generally act as boundaries where price reacts, bouncing back, slowing down, or reversing. Observing how price interacts at these levels helps traders set price targets or define levels where a trade could fail, making them useful for both entry and risk planning.
- Volume
Volume indicator shows how many units, shares, contracts, or lots have been traded over a specific period. It offers insight into how much interest or activity there is behind a price move. A strong move in price backed by high volume is often seen as more meaningful than one with low volume. Sudden spikes in volume can signal increased participation, especially during breakouts or sharp moves. Volume analysis also helps assess whether buyers or sellers are more active at certain price levels. Low volume during large price swings might indicate that the move lacks strength or extensive participation.
- Momentum Indicators
Momentum tools help track how fast or strong the price is moving across a chosen period. Such tools assist traders in judging if prices have changed excessively over a short duration. Some of the most commonly used ones are the moving average convergence divergence (MACD), which tracks the distance between two exponential moving averages; the average directional index (ADX), which measures directional strength; the rate of change (ROC), which captures the percentage change in price;the RSI also known as relative strength index which identifies extreme buying or selling; and the stochastic oscillator, which compares price to its recent high-low range.
- Moving Average
A moving average helps level price action by computing average closes across a set period. This reduces random price noise and highlights the broader price behavior. The simple moving average (SMA) is the most basic form, calculated by summing selected session closes and dividing by the total number of periods. The formula to calculate SMA is:
SMA = (P₁ + P₂ + … + Pₙ) / n
Another type, the exponential moving average (EMA), gives more weight to recent prices to react faster. Moving averages are often used to spot whether price is holding above or below a key range over time.
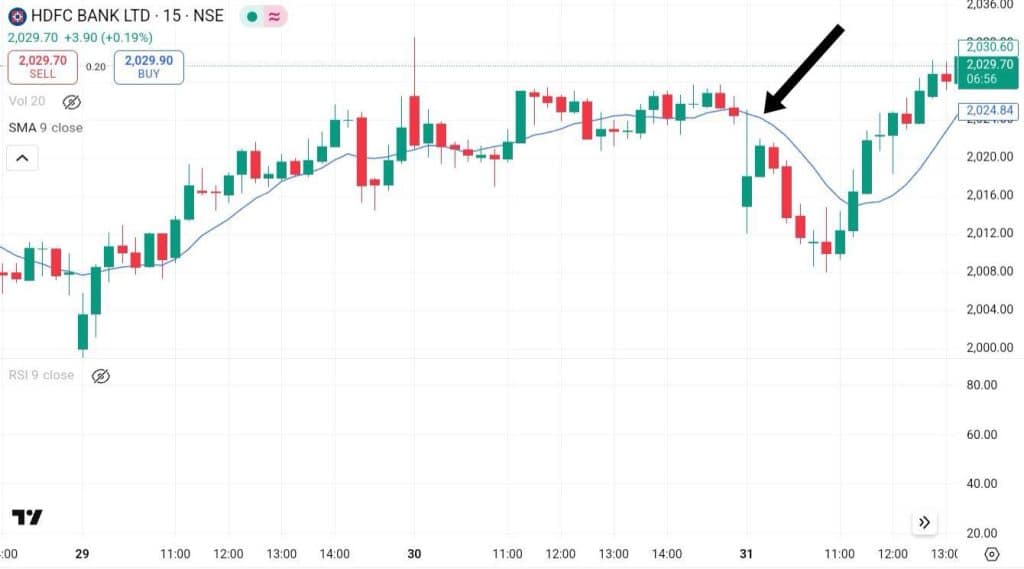
For example, below is a chart of the HDFC Bank Ltd. with a 9-period simple moving average (SMA) marked as a blue line. It shows how the average line moves with the price, helping smooth out short-term fluctuations and making the overall direction easier to observe.

- RSI
RSI stands for relative strength index, a momentum-based tool used to evaluate the strength of recent price movements. It evaluates recent gains against losses to see if an asset has leaned heavily toward one price direction. The result appears on a chart ranging between 0 and 100. Readings above 70 suggest that price has risen rapidly and may be considered overbought, while readings below 30 suggest it has fallen quickly and may be considered oversold. RSI is calculated using the formula:
RSI = 100 – [100 / (1 + (Average Gain / Average Loss)]
It is commonly measured over 14 periods.
Let’s understand better with the help of a chart of HDFC Bank Ltd., the purple line in the lower panel represents the RSI. This line rises and falls within a shaded band between 0 and 100. Around the point shown, it rises toward 70, showing strong buying. The yellow line smooths it.
Fundamental Analysis vs. Technical Analysis
Fundamental and technical analysis take two very different paths to studying stocks. One focuses on business value, while the other focuses on market behavior. Both are widely used depending on the investment approach. Here’s how they differ:
| Category | Fundamental analysis | Technical analysis |
| Approach | Examines business performance, industry position, and financial health. | Studies price charts, volume, and patterns formed by market activity. |
| Main inputs | Financial statements, earnings reports, valuations, and economic data. | Historical price movements, technical indicators, and trading volume. |
| Objective | To ascertain a company’s actual value and match it with the present market valuation. | To interpret price behavior and identify possible market directions. |
| Time focus | Mostly long-term, looking at a company’s future potential. | Often short to medium term, based on recent market data. |
| Tools used | Ratios like P/E, P/B, ROE, and models like DCF. | Indicators such as RSI, MACD, moving averages, and chart patterns. |
| Decision drivers | Business outlook, sector health, and financial performance. | Market sentiment, price patterns, and volume shifts. |
| Who uses it | Long-term investors focused on growth or value. | Active traders aiming to study short-term price behavior. |
| Drawbacks | May miss short-term market changes or fast-moving events. | Can overlook the company’s actual performance or financial risk. |
Advantages and Limitations of Technical Analysis
Here’s a look at the core strengths and weaknesses of using technical analysis:
The advantages of technical analysis include:
- It can be applied to any tradable asset, stocks, currencies, commodities, or crypto as long as historical price data is available.
- Tools like charts and indicators provide a clear, visual way to understand price behavior without needing deep financial knowledge.
- It supports quick decision-making, especially in short-term trading, by focusing on entry and exit points using price-based signals.
- Can be applied across any different market phases. Rising, falling, or sideways choosing different indicators or chart patterns suited to the situation.
- Many platforms offer built-in tools and real-time data, making technical analysis accessible even to those new to the markets.
The limitations of technical analysis are:
- Chart reading is often subjective; different analysts may interpret the same setup differently.
- It relies on past data, so signals may come too late during rapid market movements.
- In sideways or range-bound markets, indicators may produce false signals and lead to poor timing.
- It excludes external influences such as earnings reports, prominent news, or major economic developments.
- Popular patterns may become self-fulfilling and lose effectiveness as more traders rely on them.
Assumptions Of Technical Analysis
The approach of technical analysis is built around three main ideas that guide how analysts study charts and price behavior. The main assumptions are as follows:
- All market information is captured by price: This principle suggests that the current price includes everything that can affect the asset. Be it news, earnings, global events, or investor behavior. Since price captures all known inputs, studying charts alone is considered sufficient for analysis.
- Price follows a direction over time: This assumption is based on the idea that prices don’t move randomly. They often move in a direction, either up, down, or sideways over a certain time frame. Recognizing this direction early allows analysts to follow it until it weakens or changes.
- Market patterns reappear: Market movements are believed to repeat themselves, largely because people react in familiar ways to similar situations. As a result, certain price formations, such as breakouts, consolidations, or common candlestick shapes are expected to show up again. This forms the basis for using past patterns to interpret present market behavior.
Indicators of technical analysis
Technical analysis indicators are mathematical calculations based on price, volume, or open interest that help traders gauge market sentiment and predict future price movements. These tools simplify complex price data and make it easier to spot trends, reversals, and potential entry or exit points. Some key indicators include:
- Moving Averages (MA) – Smooth out price fluctuations to identify trend direction. They help confirm whether a stock is in an uptrend or downtrend.
- Relative Strength Index (RSI) – Measures the speed and change of price movements to show overbought or oversold conditions. Values above 70 suggest overbought; below 30 indicate oversold.
- Moving Average Convergence Divergence (MACD) – Shows the relationship between two moving averages. It helps spot momentum shifts and trend changes.
- Bollinger Bands – Use standard deviations around a moving average to highlight volatility. Wider bands indicate higher volatility; narrower bands suggest calm conditions.
- Stochastic Oscillator – Compares a stock’s closing price to its price range over a specific period, helping identify potential reversal points.
- Average True Range (ATR) – Measures market volatility by showing how much a stock moves on average, helping traders manage risk.
- On-Balance Volume (OBV) – Tracks volume flow to confirm price trends. Rising OBV suggests buyers are in control; falling OBV shows selling pressure.
By combining multiple indicators, traders can build a clearer picture of market conditions, improve timing for trades, and make more confident decisions. Indicators are not perfect on their own, but when used with price action and support/resistance levels, they become powerful tools in a trader’s toolkit.
Conclusion
Markets speak in price and technical analysis is how traders listen. By turning raw data into patterns, lines, and signals, it transforms a cluttered chart into something readable. No balance sheets, no headlines, just what the market has already shown. It’s not about forecasts; it’s about patterns that repeat, levels that matter, and tools that turn market signals into something usable.
FAQs
Technical analysis studies past market data mainly price and volume on charts. It focuses on spotting patterns and using tools like indicators to understand how prices have behaved, helping traders estimate where price might go based on repeated market behavior.
To perform technical analysis on stocks, start by screening stocks, then study charts to spot patterns and essential levels. Use tools like Moving Averages, RSI, and MACD to read price behavior. The process helps define possible entry and exit points based on past movement.
Fundamental analysis focuses on company details like earnings, debt, and future plans to estimate its value. Whereas, technical analysis does not use company data. It focuses only on price and volume charts to understand how people have traded the stock earlier.
The two types are chart patterns and technical indicators. Chart patterns are visual shapes formed by price movement, while technical indicators are mathematical tools like RSI and moving averages used to study price and volume behavior.
Some of the most common methods include drawing trend lines, marking support and resistance zones, reading candlestick patterns, using bollinger bands to study price range, applying fibonacci retracement for levels, checking volume strength, spotting chart patterns, and using tools like parabolic SAR for reversals.

