If you’ve spent any time charting, you’ve likely seen shapes that hint at what the market might do next. The M pattern is a well-liked reversal pattern that may form at a change of trend direction. Identifying this pattern at an earlier stage gives traders an opportunity to jump in before a major move and to avoid the risk as well. In this blog post, we are going to deconstruct what the M pattern is, the formation of it, and how one can go about M pattern trading with conviction.
What is an M Pattern in Trading?
The M pattern is a type of technical chart pattern that resembles a letter M where it typically indicates a possible downside turnaround following an uptrend. The visual “M” shape results from the price increasing and forming two peaks (high points) and a trough (a low point), with the trough representing the bottom of the M.
A downward move following the pattern is likely when the price breaches below it after a second peak, such as after the so-called neckline, the trough. The field of activity of the traders, with the help of this chart pattern, is anticipating the reversal of trends and placement.
How the M Pattern Forms on a Chart
The M pattern trading forms in a few distinct stages:
- First Peak: After a sustained uptrend, price hits resistance and pulls back.
- Trough: Price then finds support, creating the first valley or trough.
- Second Peak: Buyers attempt to push prices higher but fail to break the first peak’s high, forming the second top.
- Breakdown: Price falls below the trough, breaking the neckline and confirming the M pattern.
M Pattern vs Double Top: Are They the Same?
The M pattern trading and the Double Top pattern are slightly different, however, they are not always the same. Both have two peaks and also signal reversals, yet there are slight differences in it. And this is a rapid comparison:
| Feature | M Pattern | Double Top |
| Shape | Clearly resembles an “M” | Two peaks, sometimes irregular |
| Breakout Point | Break below the trough (neckline) | Break below the valley between tops |
| Confirmation | Requires price close below neckline | Similar confirmation with volume spike |
| Typical Use | Emphasizes bearish reversal | Classic reversal, also bearish |
| Formation Speed | Can form over days to weeks | Usually forms over a similar timeframe |
| Psychological Signal | Buyers fail twice, sellers gain control | Buyers unable to push past resistance twice |
Each of the patterns indicates the completion of an uptrend, although they may also have minor visual or volume variations. They can be used interchangeably by traders, although the breakout should be checked to minimize false breakouts.
Psychology Behind the M Pattern
The M pattern trading indicates that there is a tug of war between buyers and sellers, let’s decode the technical analysis:
- The initial high demonstrates the number of buying interests and signs of the initial resistance.
- The trough is a point of equilibrium wherein buyers attempt to maintain the price
- The second peak indicates further attempts by buyers to push, but they are unable to push beyond the first high, signifying weakening demand.
- A drop below the trough indicates that the sellers have displaced the buyers, prompting further selling.
How to Identify a Valid M Pattern
- Clear Double Peaks
Ensure that the two peaks are clear and nearly at a similar price level. Rounded or indistinct peaks may cause unpredictable signals.
- Distinct Trough (Neckline)
Visible valleys between peaks should provide support. Price breakdown on this neckline causes the breakout.
- Volume Confirmation
Volume is usually low in the second peak but is high in the breakdown outside the neckline. Selling pressure is verified by a volume gain.
- Timeframe Consideration
The tendency is more stable on longer periods, such as 4-hour or daily charts. Very short-period patterns may be noisy and even less reliable.
M Pattern Trading Rules & Confirmation Signals
- Wait for Breakout Confirmation
Do not get into the trade at the price reaches the neckline. Confirm the breakdown with a closing below the neckline.
- Watch Volume
A spike in volume at the point of breakout assures more certainty. Such low-volume breakouts are vulnerable to failure.
- Use Additional Indicators
Bearish divergence or a decreasing momentum can be verified using momentum indicators as RSI or MACD.
Avoid Trading Immediately at the Peak
A second peak followed by an entry afterward can be dangerous. Rather, employ the breakout as the buy signal.
Entry & Exit Strategy for M Pattern
- Entry Point
When the price dips below the neckline, place a short trade with the support of a selling strength with regard to volume.
- Stop Loss Placement
Use a stop loss that is slightly above the second peak or a number of points over the neckline to prevent losses encountered on false breakouts.
- Profit Target
Measure the neckline peak. To set a reasonable profit objective, subtract this distance from the neckline.
Stop Loss & Target Placement
Proper risk management is crucial:
- Stop loss: Above the second peak or just above the neckline, stop loss prevents phony breakouts.
- Target: Project probable downside using the M pattern trading height (peak to neckline), dubbed the “measured move.”
By adhering to these levels, you limit losses and lock in gains logically.
M Pattern Example with Chart
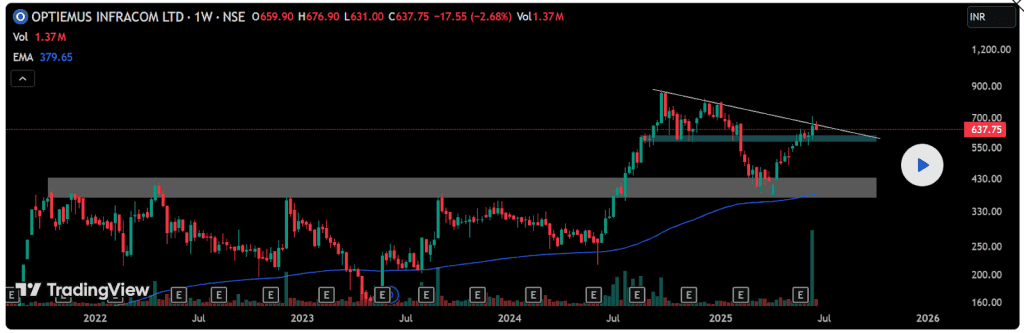
Optiemus Infracom Ltd’s weekly chart shows the formation of an M pattern with two peaks, one at approximately ₹1,000 and the other somewhat below, near ₹900. The emergence of a double-top, which is frequently linked to trend reversals, may be indicated by this structure. In addition to being in line with an important horizontal demand sector, the 550-570 zone also serves as the neckline support. Confirmation of the pattern and possible initiation of a deeper decline could be achieved by a weekly close below this neckline, particularly on high volume. It is worth mentioning that the second top has emerged with less force than the first, suggesting that the bullish pressure is waning. Near the 200 EMA, at ₹380, is the next significant support level if the neckline fails.
M Pattern Trading Strategy for Intraday & Swing
Intraday Trading
For day traders, the M pattern trading can work well on 5-minute to 15-minute charts in intraday trading. Look for quick formations with clear peaks and volume confirmation. Enter trades on breakout with tight stops to capture fast moves.
Swing Trading
Swing traders use the M pattern trading on hourly or daily charts for bigger moves in swing trading. Since these patterns take longer to form, they provide better risk-reward setups. Wait for strong breakout confirmation and set stops based on the second peak’s high.
Conclusion
The M pattern is an effective indicator when a trader wants to identify a possible reversal. Trading this pattern can be effective by knowing how it has formed, verifying the breakout by checking volume, and following good entry and exit rules. An intraday scalper or swing trader, learning how to apply the M pattern trading, allows you to predict changes in market momentum, as well as better manage your trades.
FAQs
The M pattern trading is indicative of a possible bearish reversal upon an upward trend. It indicates that twice buyers made an attempt to drive the prices up but failed, indicating decreasing demand. When the price falls below the trough (neckline) formed between the two peaks, sellers gain dominance, and a decline typically follows.
One indicator to signal an M pattern is volume in that confirmation; the presence of a spike during the breakdown adds to the read. Trading momentum with indicators N, such as RSI or MACD, will provide an assessment of weakening purchasing power or bearish divergence. The confirmation of the trend reversal could also be done through moving averages.
A bearish reversal pattern is most commonly observed in the M pattern trading. It occurs when there is an uptrend and represents a loss of purchasing power. When it reverses below the neckline (the trough in between these two peaks), it sends a message that there will be a retracement into selling pressure. Traders see this as a caution of a potential reversal of a downward trend or movement.
The M pattern and double top are both bearish reversal patterns indicated, though they are slightly different in formation and are highlighted. In the M pattern trading, it is very clear when visually charted; there are two peaks and troughs, and this registers weak buyer power. The double top can be less symmetrical and serve as a more effective reversal.
Yes, the M pattern is applicable to intraday trading on smaller time frames such as 5-minute or 15-minute charts. It enables it to identify reversals and shifts of momentum in the trading day. Nevertheless, intraday patterns may be noisy and give false signals, and it is therefore vital that it is combined or supplemented by volume and other indicators. The tight stops and rapid exits need to be adopted by intraday traders as well because of the enhanced volatility.