When markets move decisively, subtle patterns often fail to capture the intensity. This is where the marubozu candlestick becomes especially useful. With no shadows and a full body, it signals strong directional bias and market conviction. In this blog, we will discuss its basics, look at some of its examples, and learn about its benefits and more.
What is a Marubozu Candlestick Pattern?

The Marubozu candlestick pattern, from the Japanese meaning ‘bald,’ shows absence of wicks, signaling strong market momentum in one clear direction. It reflects a trading session where the price moves strongly in one direction. A bullish (green) Marubozu points to aggressive buying, whereas a bearish (red) one indicates consistent selling. Traders observe it to understand clear market behaviour during that period.
How is a Marubozu Candlestick pattern Formed?
A marubozu candlestick forms when a stock opens at its low and closes at its high, or vice versa.A bullish marubozu appears when the market opens at its lowest and ends at its peak, highlighting dominant buyer activity. A bearish Marubozu takes shape when the open is the highest and the close is the lowest, showing sellers stayed in control. These candles usually appear as long-bodied and either green/white (bullish) or red/black (bearish).
Types of Marubozu Candlestick Patterns
A Marubozu pattern can reflect strong buying or selling activity, depending on the direction of price change.
- Bullish marubozu: Appears as a green or white candle. The session begins at the lowest point and wraps up at the highest level of the day. This suggests prices moved upward consistently during the session, with buyers in control.
- Bearish marubozu: Appears as a red or black candle. The opening price equals the day’s high and the closing price equals the low. This reflects steady downward movement, dominated by selling pressure throughout the session.
How to Identify a Marubozu Candlestick on a Chart
A marubozu forms when price moves firmly from open to close without forming shadows. Bullish Marubozus opens at the lowest of the day and closes high; bearish ones start high and finish at the bottom. These candles are green or white in rising markets, and red or black when prices fall. While perfect Marubozus are rare, small differences of the candle’s range are generally acceptable for identifying the pattern.
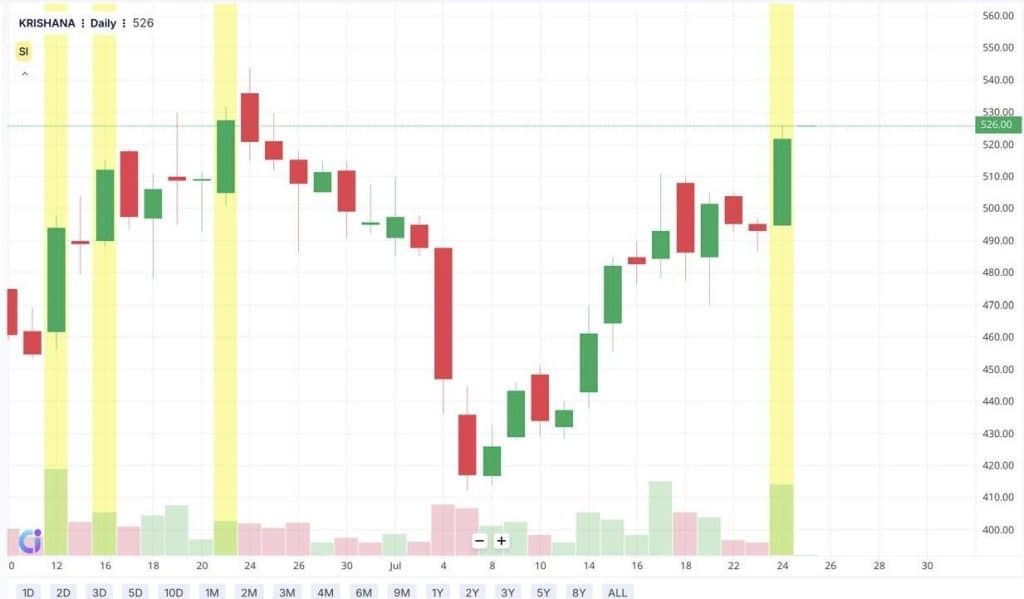
For example, as seen in the chart below, on July 24, 2025, Krishana Phoschem Ltd formed a bullish marubozu candlestick, surging by 5.83%. This candlestick demonstrates strong buying pressure, as the price opened at the day’s low and closed near the high without significant shadows.
What Does the Marubozu Pattern Indicate?
This pattern shows strong market activity without much hesitation, here’s what it indicates:
- Reversals: A marubozu with no wicks and a full body often appears when the market is changing direction.A bullish marubozu after a down move may hint at buyers stepping in strongly. A bearish marubozu after a rise may suggest sellers are taking control.
- Confirmation: It can support the current price movement by showing commitment from participants. In a rising market, a bullish Marubozu signals continued buying interest. In a falling market, a bearish one shows strong follow-through from sellers.
- Volume: It adds depth to the reading of a marubozu. When a marubozu forms on high volume, it reflects stronger conviction, buyers in the case of a bullish candle, and sellers for a bearish one.
How to Trade Using the Marubozu Candlestick Pattern
With the pattern understood, let’s look at how to apply the marubozu candlestick pattern for technical analysis while trading.
- A bullish Marubozu during a rising market often shows strong buying interest and may suggest that the price could keep moving upward.
- A bearish Marubozu during a falling market indicates steady selling activity.
- Checking on the high and low of the marubozu candle can act as reference points for future price reactions.
- These candles, especially when they appear after extended moves, can sometimes mark a change in price direction.
- Always look out for the volume along with the candle. A Marubozu supported by high volume adds weight to the market’s direction shown by the candle.
- Use these candles with other confirmations to help build a more complete view of the price action.
Best Indicators to Combine with Marubozu
Using marubozu with other indicators can help understand price behaviour better. The most widely used ones are listed below:
- Exponential moving average
EMA gives more weight to recent prices and helps identify the market direction. A bullish Marubozu above the EMA suggests prices may continue higher, while a bearish one below the EMA supports weakness.
- Relative strength index
RSI measures whether a stock is overbought or oversold. A bullish Marubozu with RSI above 70 may indicate a reversal, while a bearish Marubozu with RSI below 30 may suggest selling pressure is overdone.
- Moving average convergence divergence
MACD is used to study price direction using two moving averages. When a bullish Marubozu forms as the MACD crosses over its signal line, it may act as added confirmation.
- Volume spike
A sudden rise in volume shows stronger participation. If a marubozu forms along with a volume spike, it adds weight to the move, showing stronger conviction among traders.
Types of Marubozu Candles
The Marubozu candle represents strong momentum — either bullish or bearish — with little to no wicks. It reflects clear control by one side of the market. There are three main types:
1. Full Marubozu
A Full Marubozu has no upper or lower shadows, meaning the candle opens at the low and closes at the high (bullish) or opens at the high and closes at the low (bearish).
- Indicates: Pure buying or selling dominance.
- Usage: Strong continuation or breakout confirmation signal.
2. Open Marubozu
An Open Marubozu has no shadow on the opening side, but a small wick on the closing side.
- Bullish example: Opens at the low, closes near the high.
- Bearish example: Opens at the high, closes near the low.
- Indicates: Momentum at open with minor hesitation at close.
3. Close Marubozu
A Close Marubozu has a shadow on the opening side, but closes firmly at the extreme end.
- Bullish example: Closes at the day’s high.
- Bearish example: Closes at the day’s low.
- Indicates: Strong conviction by the dominant side into the session close.
Advantages of the Marubozu Pattern
The key benefits of using the marubozu candlestick are discussed below:
- Clear direction: A bullish Marubozu shows strong buying pressure from open to close, while a bearish one reflects consistent selling. This helps in quickly gauging market behaviour.
- No confusion in price: Since the candle has no upper or lower wicks, the opening and closing prices are easy to read, removing doubts about intra-day movements.
- Simple to identify: Being a single candle pattern, marubozu is visually obvious on charts, making it accessible even to beginners learning to read price action.
- Often reliable: It can be a dependable indicator of price movement direction, especially when combined with other tools like volume or moving averages to avoid false signals.
Limitations of the Marubozu Pattern
Some key drawbacks of the Marubozu pattern are as follows:
- Limited price information: The candle only reveals the opening and closing prices, leaving out the day’s highest and lowest points. This can mask important intra-day volatility.
- Restricted applicability: Marubozu works best in markets showing clear directional moves. In choppy or sideways markets, it offers little insight and can be misleading.
- Risk of over-reliance: Using Marubozu alone may cause traders to miss other vital signals. Excessive dependence on this pattern without other confirming indicators reduces its effectiveness.
- Best used with confirmation: To reduce errors, it should be used along with additional indicators such as MACD, RSI, or support and resistance levels for a fuller picture.
Common Mistakes When Using Marubozu
Some of the most common mistakes traders make while using the marubozu candlestick pattern are as follows:
- A Marubozu candle on its own might not say much in a sideways or unpredictable market, making it risky to act without checking the broader chart setup.
- If the pattern forms without strong volume, it may not reflect real buying or selling strength, leading to a false signal.
- Acting on every Marubozu that appears can lead to overtrading and poor decision-making, especially if other supporting signals are missing.
Marubozu vs Other Candlestick Patterns
The main differences between marubozu and other candlestick patterns are displayed below:
| Pattern | Key feature | Meaning |
| Marubozu | Long body, no wick | Strong buying/selling pressure throughout |
| Engulfing | Covers previous candle’s body | Covers previous candle; signals a reversal |
| Doji | Almost equal open and close | Market indecision; price closes near open |
| Hammer | Small body, long lower wick | Appears after fall; hints at buyer reaction |
| Shooting star | Small body, long upper wick | Appears after rise; shows selling pressure |
Conclusion
The elegance of a marubozu candlestick pattern lies in its simplicity. No wicks mean no mixed messages; the market picked a side and stuck with it. Yet, that clarity sharpens further when cross‑checked against trend lines, oscillators, or key news events, helping observe not just direction but the conviction fueling it.
FAQs
A marubozu is a candlestick with a long body and no wicks, indicating strong buying or selling pressure throughout the session. It reflects decisive market control by buyers (bullish) or sellers (bearish).
Yes, Marubozu patterns apply in forex trading. They signal strong momentum and clear dominance by buyers or sellers, useful across liquid markets like forex for spotting buying or selling pressure during a trading session.
Marubozu can be bullish or bearish. A bullish Marubozu opens low and closes high, showing buying strength. A bearish Marubozu opens high and closes low, showing selling strength.
Marubozu patterns appear on all timeframes. They tend to be more reliable on longer charts like daily or weekly but also appear in intraday setups. The strength of the pattern does not typically change, but longer timeframes may reduce “noise”.
Marubozu is quite reliable as it shows strong market momentum. Its accuracy improves with additional indicators or confirmation tools, with success rates near sixty to seventy percent when combined with technical analysis.
Marubozu is a single candle with no wicks indicating momentum. An engulfing pattern involves two candles, with the latter completely covering the former, hinting at a reversal. Marubozu signals strong continuation, while engulfing often marks a change in trend direction.
Yes, Marubozu is used in intraday trading on short timeframes to detect strong buying or selling periods, aiding decisions about possible trend continuation or reversal within the day.
The opposite of marubozu is the Doji candle, which features almost identical opening and closing levels, signaling market indecision, reflecting hesitation in the market.
A bullish marubozu is a strong green candlestick with no upper or lower shadow, showing buyers were in control throughout the session.
A red marubozu indicates strong selling pressure, where sellers dominated from open to close with little or no price retracement.
Bullish (Green/White) Marubozu – Strong buying momentum
Bearish (Red/Black) Marubozu – Strong selling momentum
Opening Marubozu – No shadow at the opening side
Closing Marubozu – No shadow at the closing side
A black marubozu is a bearish candle with no wicks, showing sellers controlled the market from open to close
A green marubozu candle signals strong bullish momentum, where the price opens at the low and closes at the high, indicating aggressive buying.