You might have got confused when you were chasing a trend and suddenly you see opposite candlestick colors. You might have thought that it could reverse, but it made new highs instead. To avoid such situations, you can use the Mat Hold Candlestick Pattern.
This pattern shows a short pause or pullback during a strong trend, where opposite-colored candles appear but don’t break the overall trend direction. It helps traders stay in the trend instead of exiting early. Let’s understand more details about the pattern.
What is a Mat Hold Candlestick Pattern?
Mat Hold Candlestick Pattern, a pattern with five candlesticks, shows a strong trend. It gives a clue that those temporary moves against the trend are just consolidation and not real reversals. When you see a Mat Hold pattern on the chart, it tells you that the stock or index will make new highs.
How is the Mat Hold Pattern Formed?
The Mat Hold has five candles, and each one plays a role:
- Candle 1: A candlestick moves strongly in the upward or downward direction.
- Candles 2, 3, and 4: These are smaller and often move slightly in the opposite direction.
- Candle 5: It breaks past the high or low of the first candle and confirms the trend has come again.
What Does the Mat Hold Pattern Indicate?
- It shows confidence of traders and investors towards the trend.
- Buyers or sellers pause and then push the trend again.
- The market checks during this pattern if the trend still holds up under pressure.
- Confirms trend continuation after a consolidation phase,
How to Identify a Valid Mat Hold Pattern
It has a big bodied candle in the trend’s direction: green for bullish and red for bearish. Then come three small candles that move in the opposite direction of the trend or stay neutral. These must not get out of the range of the first candle.
In the end, a large candle appears in the same direction as the first one and breaks its high or low. That confirms the trend will continue more and you can enter the trade.
How to Trade with Mat Hold Pattern
The safer entry is important, and hence you will need a technical analysis. Enter after the fifth candle if it gets closed above the first candle’s highest point in the upward trend or below the lowest in the downward trend.
For a bullish stock, place the stop-loss at the low of the fifth candle. For a bearish one, place it just above the opening point of the fifth candle.
How to Confirm the Mat Hold Pattern
Here’s how you check if the Mat Hold Candlestick Pattern is present:
1. Volume
Check if the last candle comes with more volume. A weak volume breakout may be a false signal.
2. Moving averages
In bullish cases, if the price stays above the 20 or 50-day averages, it means buyers are active. In a bearish stock, you must look for prices staying below these lines.
3. RSI
In a bullish Mat Hold pattern, if the RSI goes above 50, it shows that buyers are still strong. But if RSI is already above 70, it means the market might have gone too fast and could slow down or pull back.
Example of Mat Hold Candlestick Pattern
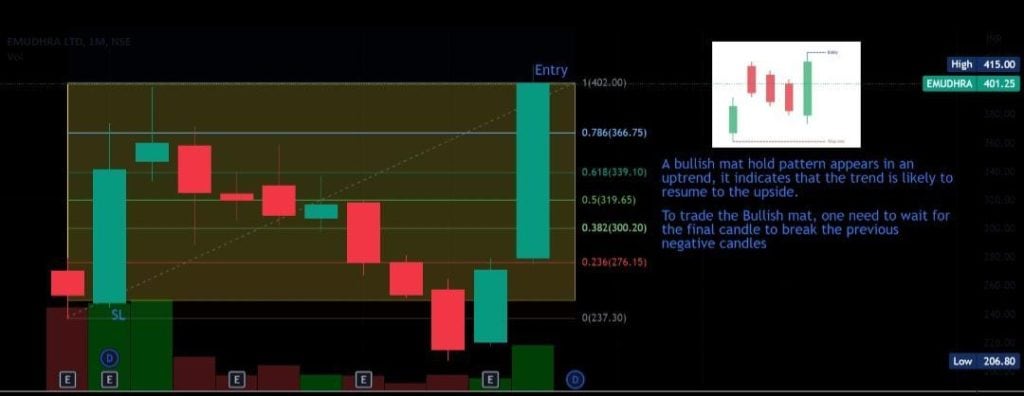
This is the chart of Emudhra stock. You can see that Fibonacci levels are used to plan smart entries and exits. Look for a bounce near 23.6% or 0% levels. As a trader, you can target 61.8% or 78.6% for profits. For more clarity, track RSI Stochastic. If it dips below 0.20 while the stock holds up, that’s a clue the stock might bounce back.
When the Mat Hold Pattern May Fail
Here’s where this pattern doesn’t work:
- Middle Candles Break the First One’s Range: In a bullish setup, if any of the small candles drop below the first big candle’s low, that’s a warning sign.
- Breakout Without Strength: If the fifth candle jumps up but immediately pulls back, that’s a fake move.
- No Support from Indicators: If tools like RSI or moving averages don’t agree with what the Mat Hold is showing, it’s better to wait.
Mat Hold Pattern vs Rising Three Methods
| Point of Comparison | Mat Hold Pattern | Rising Three Methods |
| Number of Candles | 5 | 5 |
| Middle Candle Behavior | May dip slightly below first candle’s low | Does not move above the first candle’s range |
| Candle Gaps | Can have small gaps between candles | Candles are packed tight together |
| Where It Works Best | In strong trends | In stable trends |
| Candle Color in Bullish Trend | First and last: bullish. Middle: mostly bearish or neutral | First and last: bullish. Middle: small bearish candles only |
Variations of the Mat Hold Pattern
Let’s see what are the variations of the Mat Hold Candlestick Pattern.
- Spacing Between Candles: In some versions, you might see small price jumps between candles. Other times, they stick close together.
- Modified Mat Hold: A few traders watch for this pattern where the middle candles step slightly outside the first candle’s range.
- Middle Candles Can Vary: Sometimes the three candles in the middle aren’t all bearish. One might be bullish or even a Doji.
Related Bullish Continuation Patterns
Check out these bullish continuation patterns:
1. Rising Three Method
The rising three method starts with a strong green candle, then shows three small candles that pull back but never fall below the first candle’s low. Another strong green candle pushes prices higher than before.
2. Upside Tasuki Gap
A big green candle is followed by another green candle that starts from the highest of the first. Then, a red candle appears but it only pulls back halfway and doesn’t cancel the move upward.
Conclusion
The Mat Hold Candlestick Pattern helps you chase the right trend. It tells you that even when prices pause or dip slightly, buyers are still in control. Rather than reacting emotionally to small pullbacks, this pattern makes you act smartly when strength returns.
FAQs
Mat Hold can be both, but most traders choose the bullish version. It shows the uptrend is taking a short pause before continuing. You might see a few red candles, but they don’t mean a reversal.
Yes, Mat Hold is a strong clue for swing traders. If timed right, it can help you trade the next price jump without taking losses during the pause.
Mat Hold is rare but strong when it shows up clearly. It works best when volume drops during the pause and then picks up again. But traders should match it with RSI or moving averages before trading.
Mat Hold works better on higher timeframes. On intraday charts, it may give false signals. If you still want to trade it, combine it with volume and RSI confirmation to avoid jumping in too early.
Rising Three has small candles during the pause, while Mat Hold may include a big drop in the middle. It’s more aggressive but also signals stronger control by buyers if the price breaks out again.