Getting in too early during a falling market can lead to losses, while entering too late may reduce possible gains. Many intraday traders face this problem during sharp price drops. The morning doji star candlestick pattern can show possible turning points after a decline. It presents that selling pressure may be slowing down and the price could be settling. In this blog, we explain what the morning doji star pattern looks like, what it may signal, and how to read it on a chart.
What is the Morning Doji Star Pattern?
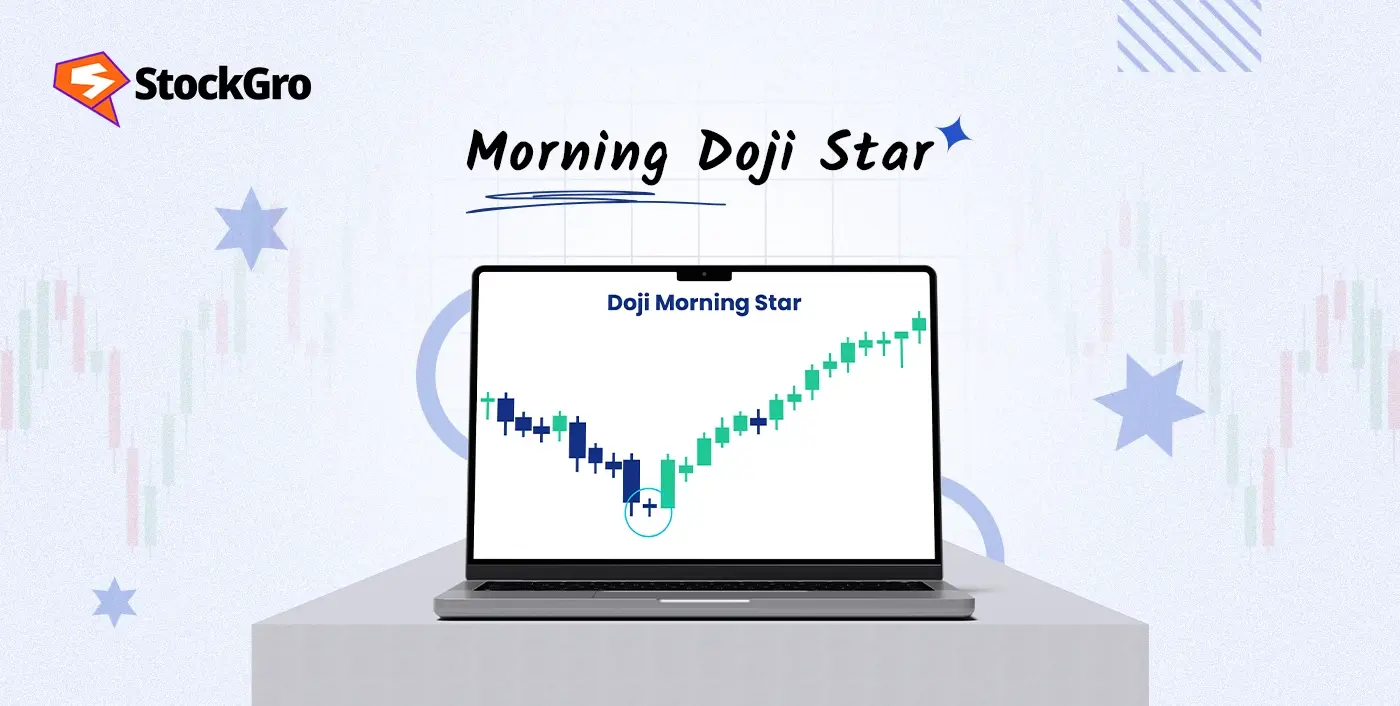
The Morning Doji Star is a bullish reversal candlestick pattern used in technical analysis to identify a potential reversal in the price of an asset. Identified by Steve Nison, a Western expert who brought Japanese candlestick charts to the West in the 1980s, the morning doji star is a 3 candle chart pattern that appears after a price drop. It’s a long red candle, a doji candle, and a long green candle, hinting at a reversal.
How Does the Morning Doji Star Form?
The pattern forms over three trading sessions with distinct candle structures:
- A long red candle signals continued selling as price closes near the low.
- A doji follows, where the open and close are nearly equal, showing market pause.
- A strong green candle follows, starting close to the low and finishing around the day’s high.
- This pattern holds validity once the closing price moves past the high of the third candle.
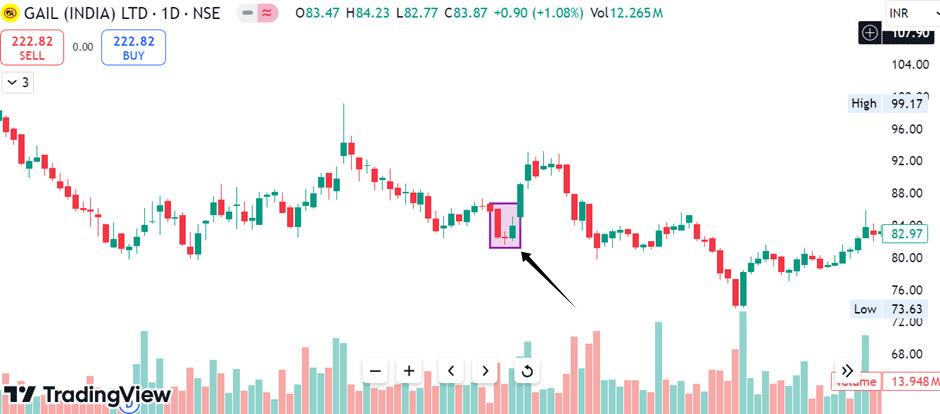
For example, the daily chart of GAIL India Ltd. shows the morning doji star pattern formation, around late January 2023. This pattern, consisting of a bearish red candle, a doji, and a bullish green candle, correctly signaling a possible uptrend in the stock’s price.
Psychology Behind the Morning Doji Star
The first candle shows strong selling as investors are still exiting, prices go lower. A doji reflects balance, showing that neither side, buyers or sellers is dominating the move. Traders start to reassess and buyers start to enter. The green candle is growing buying interest and renewed confidence, a clear change from seller dominance to buyer activity.
When Does the Morning Doji Star Appear?
The morning doji star appears at the end of a price drop. It starts with a strong red candle, then a doji that shows reduced momentum. A green candle follows, then buying. The formation gets confirmed once the price pushes past the third candle’s peak. Can be seen on intraday, daily or weekly charts..
How to Identify a Morning Doji Star
The steps mentioned below help in identifying the morning doji star pattern:
- Start with a long red candle showing strong seller control and declining prices.
- Look for a doji, where the open and close match closely, forming a narrow body with clear wicks.
- The third candle should be green and larger than the doji, indicating buyer strength.
- Confirm the setup using tools like volume or support levels to avoid false signals.
- Ensure the doji has a narrow body and long shadows, showing balance between buyers and sellers.
- Gaps between the candles and a strong third candle body improve pattern clarity.
Morning Star vs Morning Doji Star
Both the morning star and morning doji star are three-candle patterns used after a price fall, but the middle candle sets them apart. Here’s how they differ:
| Feature | Morning doji star | Morning star |
| Middle candle | A doji with nearly equal open and close | A small-bodied candle with slight direction |
| Message | Stronger balance between buyers and sellers | Mild pause in selling pressure |
| Strength | Seen as a more decisive turning signal | Considered slightly less forceful |
| Signal confirmation | Needs a strong third candle closing above highs | Confirmed if third candle closes above midpoint |
| Usage | Preferred in choppy or high-volatility situations | Commonly seen after a steady price drop |
Morning Doji Star vs Evening Doji Star
Both patterns include a doji and mark a turn in price behaviour, but they appear in opposite market phases. Let’s look at the comparison of the morning doji star and evening doji star core distinctions that separate these two patterns:
| Feature | Morning doji star | Evening doji star |
| When It appears | After a downward price move | After an upward price move |
| First candle | Long red candle showing selling dominance | Long green candle showing buying dominance |
| Middle candle | Doji, showing temporary balance | Doji, reflecting a pause after strong buying |
| Final candle | Green candle showing buying control | Red candle showing selling strength |
| What it says | Buying interest may be returning | Selling pressure may be building |
How Reliable is the Morning Doji Star?
The morning doji star is respected in technical analysis but its reliability can vary. It works best when paired with additional tools. Volume plays an integral role, higher volume on the green candle supports buying activity. Price action leading into the pattern matters too; it’s more effective after a strong price drop or near a known support area. Its appearance later in the trading day can be more meaningful. Remember to always use additional checks before acting on this pattern.
How to Trade the Morning Doji Star Candlestick
Here are the four steps to use this pattern to perform thorough technical analysis while trading:
- Identify the pattern: Spot the red candle, Doji, and green candle sequence during a down move.
- Confirm the setup: Use technical tools like RSI divergence, breakouts above resistance, or moving average crossovers.
- Entry point: Enter near the green candle’s open or above resistance, stop loss below the Doji.
- Manage the trade: Monitor with trailing stops, adjust stop loss or set targets based on resistance.
This way you structure the trade and keep risk under control.
Best Timeframes to Use the Morning Doji Star
This pattern can be found on different timeframes but its significance increases on higher ones. Weekly or daily charts are more consistent, they show broader price action. On smaller timeframes like hourly or 15 minute charts the pattern will appear more frequently but may be influenced by noise or small moves. It’s usually seen after a price fall, where the Doji and green candle together indicate renewed buying interest. Traders often look for additional signs like volume spikes or indicator signals to confirm what this pattern shows.
How to Confirm the Morning Doji Star Pattern
These confirmation tools help reduce false readings by adding supportive signals to the morning doji star pattern. Below are three commonly used methods:
- Volume
Volume displays the strength behind price moves by showing how many participants are active. When the third candle of the pattern forms on high volume, it supports the idea that buyers are stepping in with conviction.
- Moving average
A moving average helps identify the broader price direction by averaging past prices. When the morning doji star forms near or above a significant moving average, it supports the idea that the downward movement may be losing strength.
- Relative strength index
The RSI assesses how stretched buying or selling has been in recent periods. If the RSI rises or shows a bullish divergence near the morning doji star pattern, this technical indicator can reinforce that buyers are gaining influence after a decline.
Advantages & Limitations of the Morning Doji Star
The advantages and limitations of using morning doji star as follows:
Pros
- Catches early signs of a price turn after a sustained drop, with a structured 3 candle setup.
- The middle doji gives a clear pause signal, making the pattern stand out more on the charts.
- Has defined entry and exit points, so you can manage your trades better.
- Visible on different timeframes, so you can trade intraday or longer term.
Cons
- On its own, the pattern can be misleading if not supported by other technicals or strong market activity.
- Overlapping patterns or unclear candle sizes can make the pattern hard to read.
- Reacts to completed price moves, so the market has already changed before the pattern appears.
- May not work as well during fast market or news driven moves.
Related Bullish Reversal Patterns
Several other candlestick patterns help observe possible changes in price flow after a decline. The main ones include:
- Hammer: Hammer is a one-candle setup featuring a small body up top and a deep lower wick. It appears after a down move and shows that buyers managed to reject lower prices by pushing the price back up before the close.
- Piercing pattern: Made of two candles, starting with red, followed by green, which opens below and closes beyond the red candle’s halfway mark. This pattern shows that buying interest returned strongly after a weak opening.
- Bullish engulfing: Bullish engulfing is a two-candle formation where a small red candle is overtaken by a bigger green one that fully wraps around. This shows buyers took control and reversed the earlier selling.
Conclusion
The morning doji star doesn’t aim to forecast big moves but helps mark areas where prices may stop falling. Its three-part form gives visual clarity on possible reversals. When paired with volume or momentum tools, it becomes a helpful addition to any price action trader’s chart.
FAQs
A morning doji star means a possible bullish reversal. It forms at the end of a down trend and shows selling momentum is weakening and buyers may take over, often leading to a change from down to up.
The morning doji star is a bullish candlestick pattern. It’s meant to indicate that a down trend may be ending and buying pressure is returning, setting up for price to go up.
The morning doji star is generally considered a reliable reversal signal, especially on higher timeframes and with strong volume. But not foolproof and works best when confirmed by other indicators like support levels, volume or trendlines.
Yes, beginners can use the morning doji star, it’s easy to spot. For best results combine the pattern with other technical tools or confirmation signals to minimize mistakes and false signals.
Morning doji star is most reliable on daily and weekly charts, where the pattern shows market trend and reduces noise. It can also appear on lower timeframes but signals are less accurate there.