
If you have ever watched a cricket match, you know the scoreboard isn’t just about runs; it is about who’s batting and who’s bowling well. In the stock market, the price chart is like the runs column, but the volume is what tells you who’s really in control.
The Net Volume Indicator is a tool that helps you read that part of the scoreboard. Instead of just presenting the overall number of trades, it breaks them down into “buying days” and “selling days” to demonstrate which side is stronger. This might help you tell the difference between real trends and price surges that don’t last long.
Understanding the Net Volume Indicator
Net Volume is built on simple logic: not all trading volumes are equal. Imagine two days, both of which have 10 lakh shares traded. On one day, the price closes higher, meaning most trades were buying-driven. On the other hand, the price closed lower, so sellers were in control.
In technical analysis, the indicator adds up all the volume from “up” days and subtracts the volume from “down” days. The result tells you the net influence. Positive values mean buyers had the upper hand; negative values mean sellers dominated.
This is valuable because sometimes prices rise on low volume, which isn’t a strong sign. Net Volume helps confirm whether the move has actual participation from traders.
How Does the Net Volume Indicator Work?
The steps are straightforward:
- Compare today’s closing price to yesterday’s.
- If it’s higher → all today’s volume is counted as up volume.
- If it’s lower → all today’s volume is counted as down volume.
- Subtract down volume from up volume. That’s your Net Volume for the day.

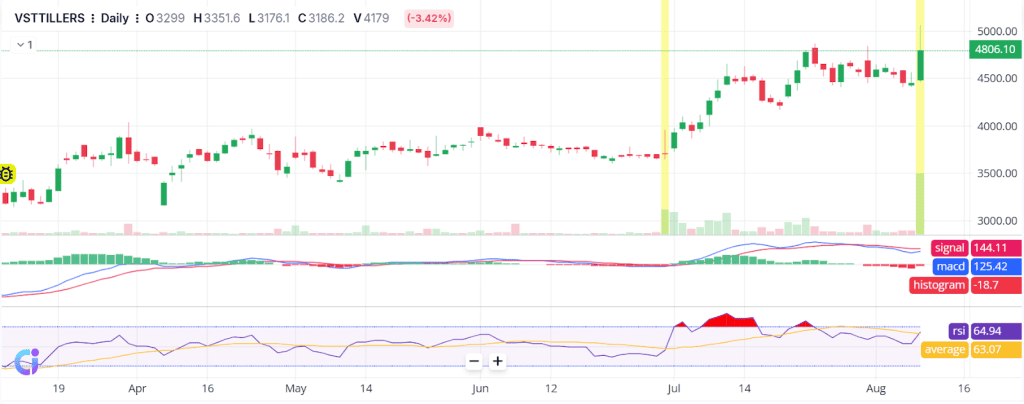
For example, on the Siemens (NSE: SIEMENS) daily chart in late March, the stock formed strong green candles. At the same time, the Net Volume Indicator showed tall positive bars. This meant that most of the day’s traded volume happened while prices went up, which showed that there was intense buying pressure. A robust rise is usually signalled by a positive net volume and rising prices.
From late June to early August, several red candles appeared on the chart. Net Volume bars mostly stayed negative, showing selling volume outweighed buying volume. Even when prices bounced slightly, net volume often remained below zero, a sign that buyers weren’t fully supporting the move. This mismatch between price and net volume can be an early warning that momentum is fading.
In both swing and intraday trading, this indicator helps traders read the strength behind price moves. It is not a prediction tool but a reflection of current market sentiment.
Net Volume Formula Explained
Net Volume = Up Volume – Down Volume
Where:
- Up Volume: Total traded shares on days the price closes higher than the previous close.
- Down Volume: The total number of shares traded on days when the price finishes lower than the last closing.
You can do the maths manually, but most traders use charting programs to do it right away.
How to Read the Net Volume Indicator
- Positive Net Volume → More buying pressure, often linked with bullish sentiment.
- Negative Net Volume → More selling pressure, signalling bearish sentiment.
- Sharp spikes (positive or negative) → Potential start of a strong move or reaction to news/events.
An important tip: Net Volume should be read alongside price action. If price is climbing but net volume is small or declining, the rally may not be sustainable.
Net Volume vs. Other Volume Indicators
- Regular Volume → Shows total shares traded, with no clue about bullish vs bearish activity.
- On-Balance Volume (OBV) → Based on how the price moves, it adds or subtracts the entire volume from a running total.
- Money Flow Index (MFI) → Adds together price and volume to show if something is overbought or oversold.
Net Volume, on the other hand, looks at what’s going on inside the candlestick and breaks out the buying and selling volume for that time period. This makes it preferable for short-term analysis.
Net Volume Trading Strategies
Before jumping into any trade, it’s essential to know whether the market momentum is backed by real buying or selling interest. The Net Volume Indicator can help you spot this.
Using Net Volume for Trend Confirmation
Let’s say a stock is in a steady uptrend. If the Net Volume remains positive, it means buying interest is consistent. If it suddenly turns negative while the price still rises, it’s worth being cautious; the uptrend may be losing real support.
Using Net Volume for Divergence Signals
Divergence happens when the indicator and price don’t move in sync.
- Price makes new highs, but Net Volume doesn’t → momentum might be fading.
- Price makes new lows, but Net Volume stays flat or rises → sellers might be losing steam.
These signals are not going to guarantee anything, but they do tell traders to pay attention to the market.
Advantages and Limitations of the Net Volume Indicator
| Advantages | Disadvantages |
| Very simple to understand and read. | Treats all price changes equally, even small ones. |
| Makes it clear who’s dominating the market, buyers or sellers. | Can be misleading when equities don’t trade much or on market holidays. |
| Can be used for any time frame, from short-term to long-term investing. | Works best as part of a broader technical analysis setup. |
Best Settings for Net Volume Indicator
Depending on how you trade, you should change the time frame. For day trading, use shorter time frames; for swing trading, use longer ones. Combining net volume with moving averages or RSI can also help you get better signals.
Conclusion
The Net Volume Indicator is a simple but powerful way to find out who is winning the buying fight and what people think about the market. You can make better trades with more confidence if you know how to read it and use it with other analysis. You will soon be able to easily see trends and reversals if you keep practising!
FAQs
You can use the net volume to figure out if buying or selling pressure is stronger, which can help you forecast what will happen to prices in the future. It doesn’t always work on its own, but when paired with other indicators, it can help create better predictions and confirm market trends.
Yes, net volume works for any length of time, from minutes to hours to days to weeks. Day traders can spot quick opportunities in shorter time frames, while swing or position traders can see bigger market trends and patterns in more extended time frames.
You figure out net volume by comparing how much trading happened on rising price periods versus falling price periods. If more trades happened during up moves, it’s positive; if more happened during down moves, it’s negative.
The net volume strategy looks for strong buying or selling pressure to predict possible price direction. Traders watch for big increases in net volume as a sign that a trend might start, continue, or reverse soon.
To trade with net volume, watch when it moves sharply positive or negative. Strong positive net volume can mean it’s time to purchase, while strong negative net volume can mean it’s time to sell. Always check for price activity or other signs before taking action.