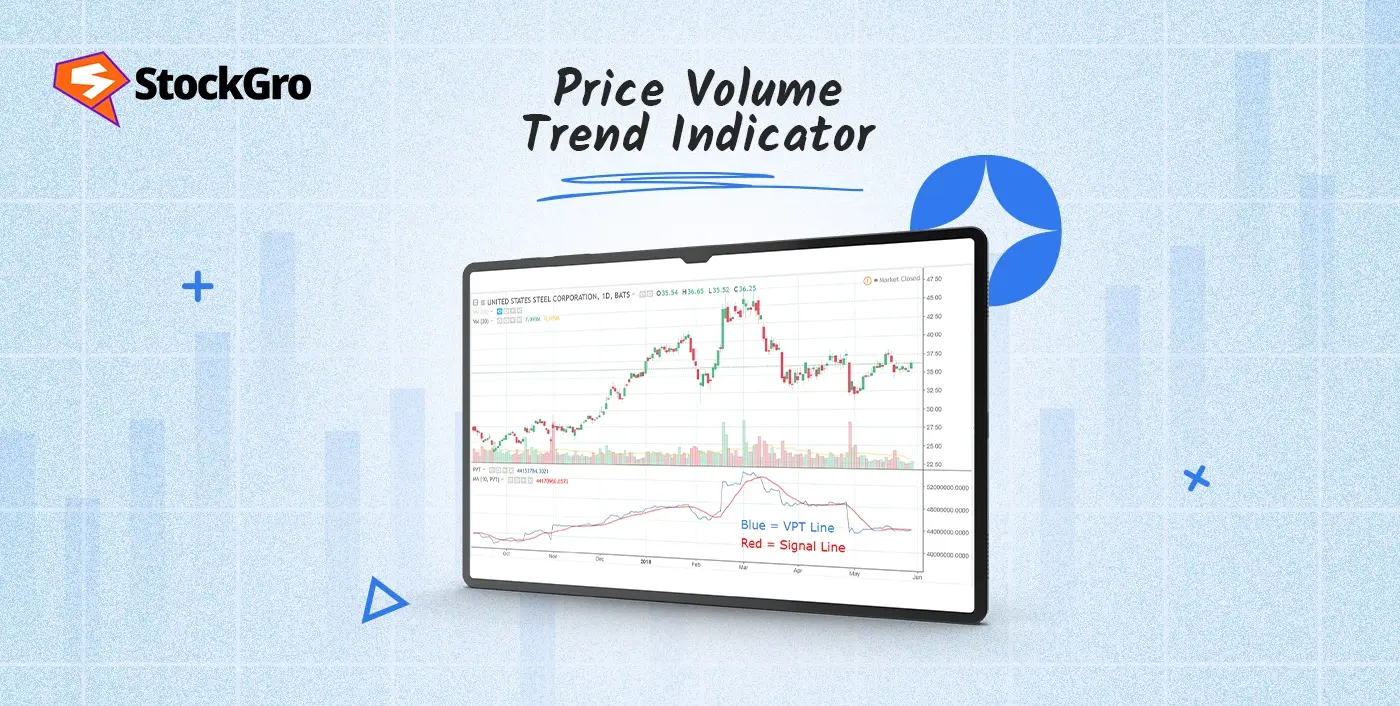
If you have ever watched a stock price move and wondered whether the volume is backing that move or not, the Price Volume Trend (PVT) indicator might be the clue you need.
It is essentially a running score that shows if a trend is getting stronger or weaker by looking at price changes and trade volume. For young traders exploring virtual stock markets, PVT is a simple but smart way to confirm price moves before jumping in.
What is the Price Volume Trend Indicator?
The Price Volume Trend indicator is a type of momentum tool that combines a stock’s price changes with its trading volume. Unlike regular volume bars that just show the amount of trading, PVT adjusts volume based on the percentage change in price. This gives you a clearer picture of whether price moves are backed by genuine market interest.
When PVT is rising, it means there is more buying pressure supporting the price hike. When it falls, selling pressure is likely taking over. This indicator helps traders assess whether a trend has the strength to continue or is beginning to lose momentum.
How Does the Price Volume Trend Work?
PVT works by tracking the flow of volume as adjusted by price movement. Each new period compares the closing price to the previous one:
- If the closing price goes up, PVT adds volume proportionate to how much the price increased.
- If the closing price falls, PVT subtracts volume proportionate to the price decrease.
PVT keeps track of these changes over time and creates a running total that shows the net purchasing or selling pressure.
This cumulative method helps reduce noise and shows the momentum underlying price changes. When the price and PVT move together, a healthy trend is observed. But when price and PVT diverge, it warns that volume may not support the price move, signalling a possible reversal ahead.
PVT Formula and Calculation
Here is the straightforward formula used to calculate PVT:
PVT= PVTPrevious+(CloseCurrent- ClosePrevious ClosePreviousVolumeCurrent)
Explanation:
- PVTPrevious – The PVT value from the previous period
- CloseCurrent – Closing price of the current period
- ClosePrevious – Closing price of the previous period
- VolumeCurrent – Trading volume during the current period
You start from a base value (commonly zero) and keep adding or subtracting volume adjusted by the percentage price change each period. This running total reflects whether volume is flowing into or out of the stock in line with price moves.
How to Trade Using the PVT Indicator
The PVT indicator is a useful tool in technical analysis and can support several trading tactics, especially for trend confirmation and spotting reversals:
- Trend Confirmation: When both price and PVT rise together, it confirms strong buying interest and suggests the trend may continue. Likewise, if both fall together, selling pressure is likely dominant.
- Spotting Divergences: If the price makes new highs but PVT doesn’t follow, it warns traders that momentum may be fading and a reversal could be near. The same applies to price bottoms that are not confirmed by rising PVT.
- Breakout Validation: Before entering a breakout trade, check if PVT supports the move by rising with price. If not, the breakout might not have enough volume and fail, which will help you avoid misleading signals.
Price Volume Trend vs On-Balance Volume
Although both On-Balance Volume (OBV) and Price Volume Trend monitor price and volume, they approach the task differently:
- On-Balance Volume (OBV): It disregards the magnitude of price changes. It simply tallies the volume for all the days the price increases and subtracts the volume for all the days it decreases.
- Price Volume Trend (PVT): The volume adjusts based on the fluctuations in the closing price, making it responsive to those price changes.
Due to this distinction, PVT might occasionally see early changes in momentum even when prices don’t vary much but volume does, while OBV treats all up or down days the same in terms of volume.
Best Settings for PVT
One great thing about the PVT indicator is that it doesn’t require complex settings. It naturally adjusts as it uses the percentage price change and volume for each period. You can apply it on:
- Daily charts (most common for swing traders)
- Intraday charts (minutes or hours) for day traders
- Weekly or monthly charts for longer-term views
Most charting tools come with a default setup that works well. Beginners can start with that and then try out different timeframes based on how they trade.
PVT Trading Strategies
The Price Volume Trend (PVT) indicator is a sophisticated tool that combines price changes with trading volume to show traders how strong market shifts are. Here are some useful and thorough tips for utilising PVT well:
- Trend Confirmation:
One of the most straightforward PVT strategies is confirming trends. When both price and PVT go up at the same time, it means that there is strong purchasing momentum that is pushing the price up. On the other hand, when both go down, there is a lot of selling pressure.
If you trade in line with this confirmation, your chances of success go up because trends backed by volume are more predictable and less likely to fool you out.
- Divergence Trading:
Divergences between price and PVT are key signals for early reversals. A bearish divergence happens when price reaches new highs, but PVT fails to follow with a corresponding peak. This shows weakening buying volume, warning of a potential top.
On the other hand, a bullish divergence happens when the price sets new lows but the PVT shows higher lows. This indicates that there is less pressure to sell, and more people may be buying. Traders who are quick to recognise these changes have a better chance of making money because they can enter or exit positions before the market as a whole.
- Breakout Validation:
Many traders jump on breakouts without volume support and get caught in false moves. PVT helps validate breakouts by confirming if volume supports the price surge. A breakout with a rising PVT means that the surge is based on real interest and is likely to sustain. Watch out for PVT falling behind or dropping. If it does, the breakout might not work.
- Combination with Moving Averages:
Adding a simple moving average (SMA) to the PVT indicator makes the signals to buy or sell clearer by getting rid of noise. PVT is a buy signal when it crosses its SMA from below, and when it crosses down, it suggests a sell or short position. This strategy reinforces the usage of basic trend-following and volume confirmation for determining entry and exit points.
When you utilise these tactics with additional tools like RSI, support and resistance levels, or chart patterns, they work better. They also help you handle risks better. Using PVT wisely supports disciplined trading and sharper market reading.
Limitations of the Price Volume Trend Indicator
While useful, PVT isn’t perfect:
- Lag in signals: Since PVT uses historical price and volume data, it can react slowly to sudden price changes.
- False signals in volatility: Readings may not be accurate in choppy or very unstable markets.
- Needs confirmation: Works best when combined with other indicators for clearer trade decisions.
Conclusion
The Price Volume Trend Indicator is a smart way to look at changes in price and volume to discover if the market’s moves are really powerful. Keeping volume context in mind helps you confirm trends, see early reversals, and avoid false breakouts.
Keep your setup simple, seek for clear signals like trend confirmation and divergence, and try out your ideas on virtual platforms. This basic yet useful sign will help you make better trading decisions as you learn more about the market.
FAQs
The Price Volume Trend (PVT) indicator shows how price changes impact trading activity. It gives traders insight into prevailing market momentum, indicating the presence of either buying or selling pressure, which means a trend is either continuing or has reversed.
PVT works on any timeframe, but daily and hourly charts are popular for clearer trends. Shorter timeframes can be used for intraday trading, though they may have more noise and false signals in volatile conditions.
When PVT moves up, it suggests more buying pressure. When it moves down, selling pressure is likely. When the price goes up and the PVT goes up, it shows that the trend is strong. When the price goes down and the PVT goes down, it shows that the trend is weak.
Yes, you can utilise PVT for intraday trading, especially to find changes in momentum. But to avoid making mistakes because the market changes quickly, it should be utilised with other indications or chart patterns.
Both PVT and On-Balance Volume (OBV) track price and volume together. The main difference is PVT changes in proportion to price percentage changes, while OBV only adds or subtracts total volume based on price direction.