Charts can change direction before you even have a moment to act. Sudden moves may seem random, but short-term breakout trading offers a way to read the signs early and act with accuracy. By learning to enter and exit at key points, traders can navigate fast price changes more methodically, turning fleeting market swings into opportunities. In this blog, we discuss what these short-term breakouts are, how to identify them, examples and more.
What is a Short Term Breakout?
A short term breakout occurs when the price of a stock or other financial asset rises above a resistance level within a short period. Resistance is a price point where selling pressure has earlier prevented the price from moving higher. When the price crosses this level, it suggests that buyers have gained control, at least for the time being. Short-term breakouts are commonly studied on intraday or daily charts and are often part of breakout trading, where the move is seen as a possible continuation in the direction of the breakout.
How Short Term Breakouts Work
A short term breakout is studied within technical analysis to understand price behavior on shorter timeframes. It works in the following way in intraday trading:
- Price movement beyond main levels: When the price surpasses a resistance level or drops below support, it shows that the forces of supply and demand have temporarily shifted. This movement often attracts attention from traders monitoring short-term price changes.
- Volume confirmation: A significant volume at the breakout adds credibility. More volume means many people are trading at the breakout level, so the move is more significant and less likely to reverse immediately.
- Entry and exit points: Traders enter near the breakout price to get the initial move. Stop-losses are placed below the previous support or above the previous resistance to manage the risk if the price reverses.
- Short-term focus: Breakouts are on short time frames, intraday or daily charts. Price can move in the breakout direction for a few hours to a few days, giving short-term trades.
- Market reaction: After a breakout, price can move fast as other traders notice and act quickly, which can amplify the price move in the breakout direction.
How to Identify Short Term Breakouts
The main signs of a short term breakout are discussed below:
- Price action: A close above resistance or below support is the most direct sign of a breakout. Strong candles with big bodies that go beyond previous levels mean buyers or sellers are in control. Analysts look for a close that goes way beyond the old level, not just a marginal step.
- Increased volume: Breakouts with a lot of volume carry more weight as it shows more people are participating. Sudden spikes in activity helps separate real breakouts from fake ones, as higher volume means stronger conviction behind the price change.
- Chart formations: Breakouts often follow well known patterns like triangles, pennants, flags or channels. These patterns are periods of consolidation where price is restricted. When price finally breaks out of these structures it means the market has chosen a new direction, often with more intensity.
- Confirmation: To reduce the chance of misreading false moves, many wait for confirmation. This could be an additional candle closing beyond the breakout point, or a retest where price pulls back to the breakout level, holds steady, and then resumes its move. Such checks add more reliability to the observation.
- Relevant timeframe: Short-term breakouts are on intraday, daily or short weekly charts. Their effects can last from a few days to several weeks, making them perfect for short holding periods where timing is important.
Short Term Breakout vs Long Term Breakout
Both types of breakouts serve different purposes in trading, and here’s how they differ:
| Aspect | Short term breakout | Long term breakout |
| Timeframe of chart | Intraday (minutes, hours) or daily | Weekly, monthly, yearly |
| How long it lasts | Hours to a few days, sometimes weeks | Months to years |
| Core levels used | Based on near-term highs and lows | Based on multi-year or multi-month levels |
| Volume behaviour | Sudden spikes in trading volume | Sustained and steady rise in volume |
| Market reaction | Sharp and fast moves, prone to false signals | Gradual but more reliable moves with wider participation |
| Nature of price moves | Quick, volatile, can reverse suddenly | Slower but stronger and more meaningful |
| Who uses it | Day traders, swing traders | Position traders, long-term investors |
Example of a Short Term Breakout Trade
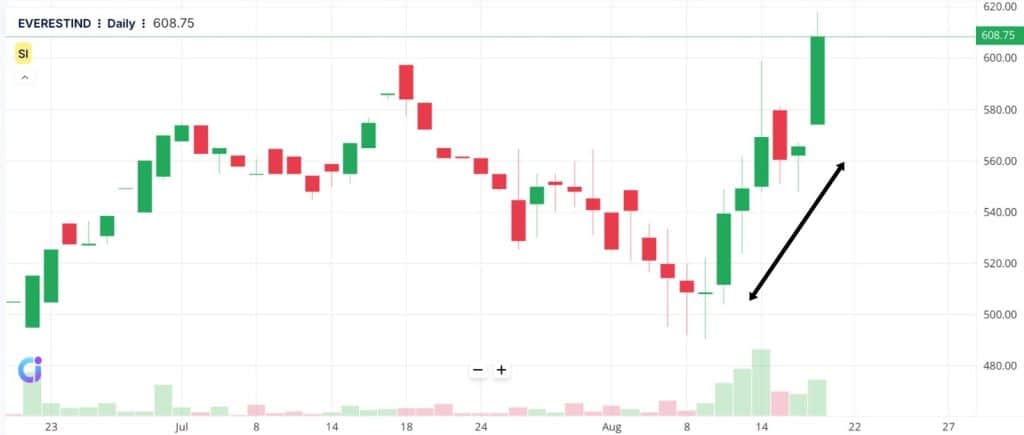
Now, let’s take an example to understand the working of short term breakout better. In this daily chart of Everest Industries Ltd., a clear short-term breakout is visible in mid-August. After bottoming out in early August, the stock started to move up. On August 19th, a long green candle closed at ₹608.75, above the previous resistance levels from late June and mid-July around ₹590–₹600. This breakout is accompanied by a significant increase in volume, indicating strong buying. The sharp price move above resistance shows how short term breakouts can happen when momentum and volume align and create a decisive move.

Common Mistakes in Short Term Breakout Trading
Short term breakout trading can be a swift strategy but mistakes often reduce its effectiveness. The most frequent errors include:
- Acting on false breakouts, where the price briefly moves beyond a key level but quickly reverses. Entering too early without waiting for a proper candle close beyond the level often leads to losses.
- Ignoring trading volume, since breakouts backed by low volume usually lack strength and are more likely to fail.
- Entering too late, waiting for too much confirmation and missing the strongest part of the move, which reduces the reward vs risk.
- Not having an exit plan, like not defining a stop-loss or profit target. Without a plan a winning trade can turn into a loss if price reverses.
- Trading breakouts against the larger market direction, such as attempting bullish setups during a weak overall market, lowers the chance of follow-through.
- Using too much leverage, where one or two failed breakouts with oversized positions can cause serious damage to account balance.
- Trading illiquid assets, where low volume and wide spreads create unreliable price moves that appear like breakouts but are often noise.
Conclusion
Short term breakout is less about speed and more about consistency. Markets will always throw up sudden moves, but it’s being adaptable and unemotional that makes long term results. Every breakout is unique and no single setup guarantees success. Treating each trade as one of many rather than a make or break moment helps you stay sane and make better decisions over time.
FAQs
A short term breakout is when a stock’s price moves sharply above resistance or below support in a short time frame, usually indicating the start of a fast move, often driven by sudden change in supply, demand or news.
Volume, moving averages, bollinger bands and momentum indicators like RSI and MACD are commonly used to spot and confirm short term breakouts. These help you judge the strength and validity of the breakout before you make a decision.
Identify clear support or resistance, wait for price to move beyond these levels on high volume and trade in the direction of the breakout. Quick exits, tight stop losses and active management helps you catch gains and limit losses due to the speed of these moves.
Popular timeframes for short term breakout trading are 1 minute to 1 hour. Many traders use 5 or 15 minute intervals to balance speed with clarity but the best timeframe depends on your trading style and the asset’s volatility.
Short term breakout trading is very risky. Prices can reverse quickly and you can lose, false breakouts are common and the speed can be stressful so strict risk management and quick reactions are essential to avoid large losses.

