Sudden price gaps on a chart can leave traders second-guessing their next move. Without clear patterns, these gaps can seem random and hard to trade around. The tasuki gap candlestick pattern steps in as a methodical signal that some traders use to read continued direction after a gap. Built from three specific candles, it appears in both rising and falling markets. In this blog, we cover everything you need to know, what the tasuki gap is, how it’s formed, and how it’s used in intraday trading.
What is the Tasuki Gap Pattern?
Tasuki gap is a continuing price gap candlestick pattern that appears during strong market moves. It appears during strong price movements and includes a gap in the same direction, followed by an opposite-coloured candle that does not close the gap. This shows that the dominant side remains strong, as the counter candle is unable to reverse the price movement.
How Does a Tasuki Gap Form?
The tasuki gap forms during a strong price movement, either upward or downward, and involves three candles. The first two have the same color and a gap between them. The third candle moves in the opposite direction but doesn’t fully close the gap. This third candle acts as a small correction. If it closes within the gap, the pattern loses its validity. The pattern suggests continuation only if the gap remains intact, with the gap area acting as support in upward moves and resistance in downward ones.
Types of Tasuki Gap Patterns
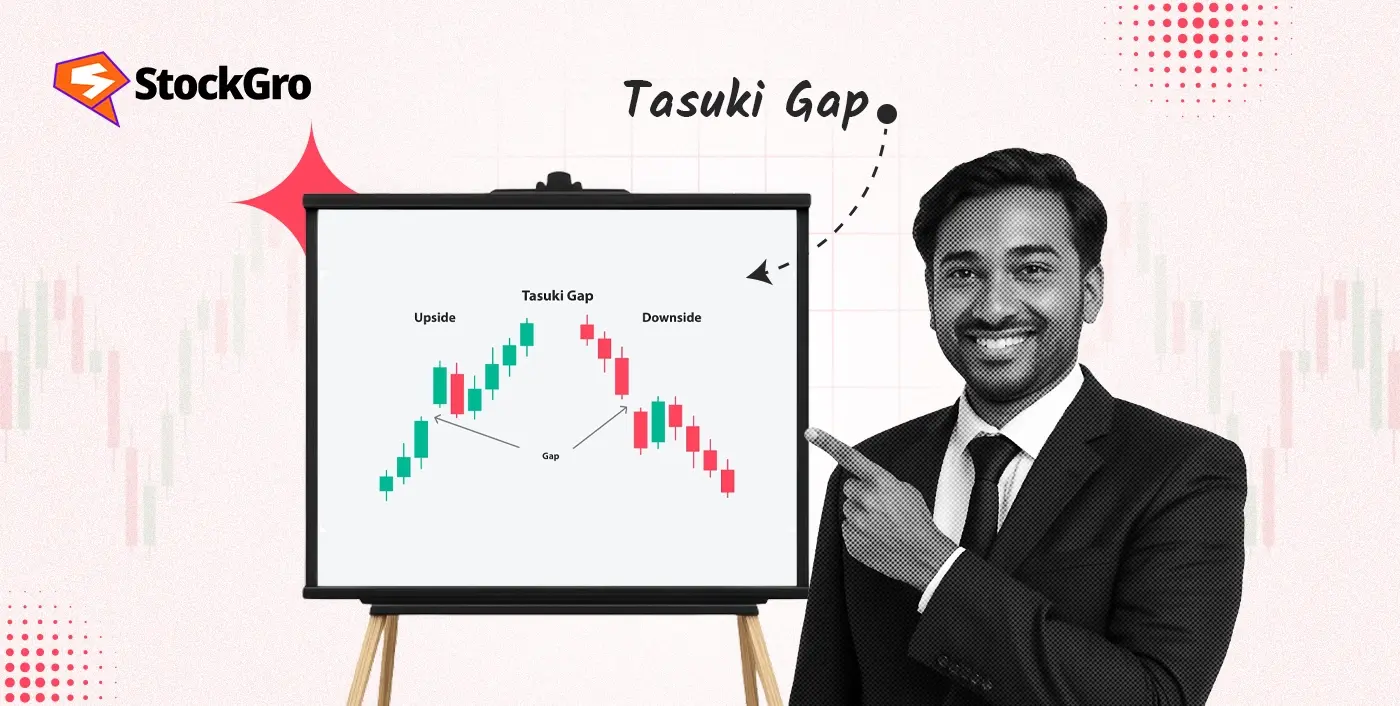
The pattern is divided into two types depending on its direction. The types are as follows:
It appears during a rising market. The first candle is a large white candle. The second opens above it, creating a gap and closing strong. The third is a small black candle that pulls back into the gap but doesn’t close it. The gap area becomes a support zone where buying often returns.
It occurs during a falling market. The first candle is a long black one. The second opens below, leaving a gap and closes lower. The third is a smaller white candle that retraces into the gap without filling it. The gap acts as resistance and selling often resumes from there.
How to Identify a Tasuki Gap on a Chart
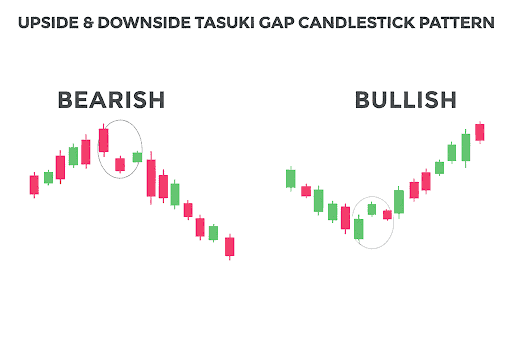
To spot a tasuki gap, look for three candles in a steady move. In an upside tasuki gap, the first two are bullish and separated by a gap up. A small bearish candle follows but doesn’t close the gap. In a downside tasuki gap, the first two candles are bearish with a gap down. A small bullish candle appears but doesn’t fill the gap. What confirms the pattern is the third candle’s inability to close the gap. This reinforces that price may continue in the same direction, especially when aligned with high volume or strong price activity.
Significance of the Tasuki Gap in Technical Analysis
The main features of tasuki gap that makes that showcases its significance in technical analysis are as follows:
- Shows strength in direction: A tasuki gap signals that buyers or sellers continue to lead, as the third candle fails to close the gap. This reinforces the idea that the earlier price move still has support.
- Gap holds as key level: The gap zone acts like a barrier, support in rising prices or resistance in falling ones. Price entering the gap but not closing it suggests strong reactions from participants at those levels.
- Gives clarity on price movement: The clear visual structure of the pattern gap followed by a failed counter candle helps spot price continuation without needing complex indicators or detailed chart analysis.
- Useful for market reading: The pattern helps understand who is in control, buyers or sellers especially when used with volume or other tools to support the reading of price direction and participant behaviour
How to Trade Using the Tasuki Gap Pattern
Trading the tasuki gap involves confirming the pattern with key indicators and following structured price levels for entering and exiting positions.
The confirmation methods are as follows:
- Volume: Volume analysis tracks how much of an asset is being traded. A strong tasuki gap is often seen with above-average volume during the gap and the first two candles, suggesting real participation.
- EMA (exponential moving average): EMA gives more weight to recent prices, helping to highlight price direction. For bullish gaps, the pattern forming above a rising EMA supports strength; for bearish gaps, it should form below a falling EMA.
- RSI (relative strength index): RSI measures the intensity of recent price moves on a scale of 0 to 100. RSI values above 50 (bullish) or below 50 (bearish) support the idea that price activity is still holding.
Once the pattern is confirmed, the next step is to define where to enter, place a stop, and set a reasonable target.
The entry and exit guidelines are as follows:
- Entry: Enter after the third candle completes and price begins to move again in the direction of the gap. Some traders wait for an extra candle to confirm this movement.
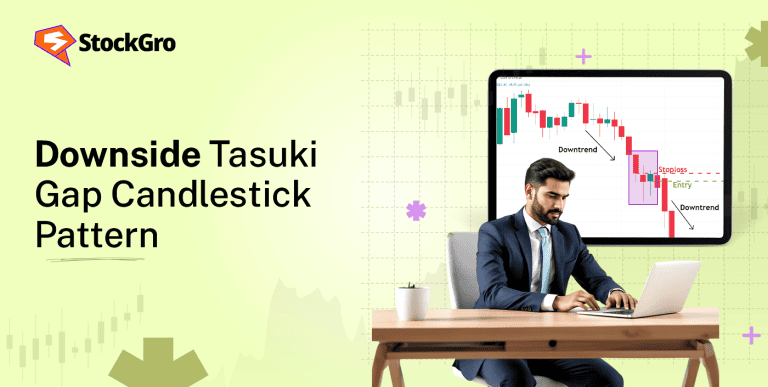
- Stop-Loss: For a bullish pattern, place a stop just below the third candle’s low or the bottom of the gap. For a bearish pattern, place it just above the high or top of the gap.
- Target: The gap height can be used to estimate targets in the same direction, or nearby support/resistance or fibonacci tools can help identify levels.
Examples of Tasuki Gap in Real Market Charts
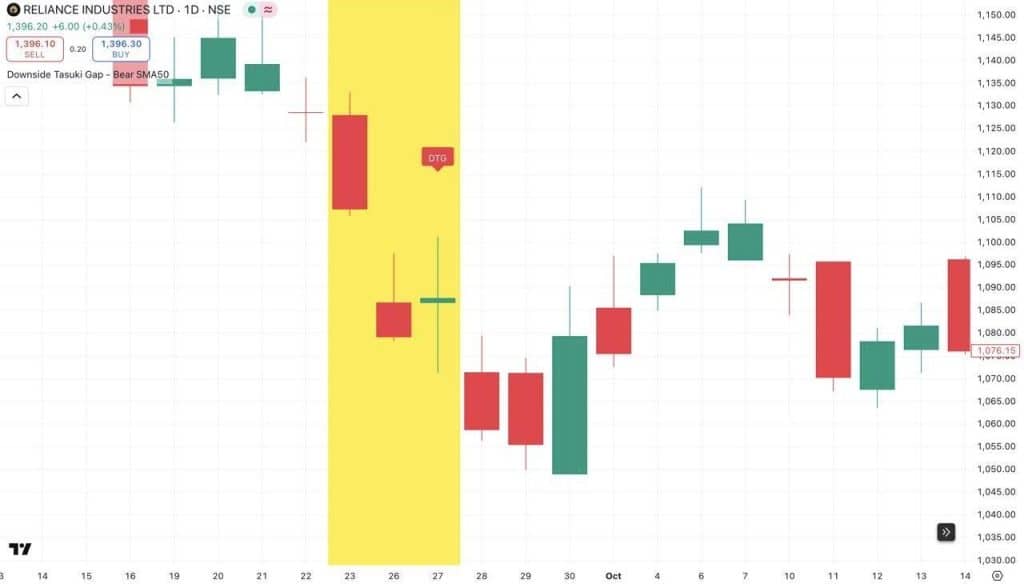
For example, the daily chart of Reliance Industries Ltd. shows a downside tasuki gap that formed on February 26, 2022. You can see how the price gapped down, creating a space between two red candles. The next green candle tried to push the price up but wasn’t strong enough to close the gap, which suggests the price might keep going down.
Limitations of the Tasuki Gap Pattern
The tasuki gap carries certain drawbacks which makes it less reliable, including:
- Gaps may close later due to external news or volatility, invalidating the setup.
- Volume confirmation is often missing, reducing the pattern’s reliability.
- The third candle may appear like a reversal but still not indicate continuation.
- Works better with broader market support and fails in sideways movement.
- May resemble other gap patterns, leading to confusion if not clearly formed.
- It doesn’t indicate entry or exit levels; it only supports existing movement.
- In illiquid stocks, gap-based patterns are often misleading due to erratic price jumps.
- Reversal signals forming soon after may neutralize the continuation view offered by the tasuki gap.
Related Candlestick Patterns
The main related patterns to tasuki gap pattern are as follows:
- Breakaway gap: Occurs at the beginning of a strong price move, with a large gap that breaks out of a consolidation or range. It typically does not get filled quickly.
- Continuation gap: Appears in the middle of a strong movement, indicating the same direction is still active. Unlike tasuki gaps, it is not followed by a candle attempting to fill the gap.
- Measuring gap: Also called a runaway gap, it appears during a strong move and often marks the halfway point of the overall move. Its placement can help estimate how much movement remains.
Conclusion
The tasuki gap gives shape to what looks like a random price jump. With its three-candle setup and unclosed gap, it adds structure to chart movements. Whether upside or downsize, the pattern signals continued direction when supported by volume and basic indicators. It doesn’t predict, but it helps understand price behavior, making it one of the more readable gap-based patterns.
FAQs
The tasuki gap pattern can be either bullish or bearish. An upside tasuki gap appears in an uptrend and signals bullish continuation, while a downside tasuki gap occurs in a downtrend, signaling bearish continuation. The pattern reinforces the direction of the prevailing trend.
The tasuki gap is considered moderately reliable, especially when it forms during a well-established trend supported by volume. However, its effectiveness may drop in slow or sideways markets. Confirming the pattern with other tools can help reduce the chances of false signals.
Tasuki gap patterns can be seen on all timeframes but are typically clearer and more reliable on daily or longer interval charts. Shorter intervals like 5- or 15-minute charts can show the pattern, but are more prone to false moves.
Yes, the tasuki gap can fail if the third candle fully closes the gap or prices reverse direction shortly after the pattern completes. Failures are more common in slower markets, which is why many traders look for confirmation before acting.
A tasuki gap is typically confirmed if the third candle does not close the gap and price continues moving in the original direction. Stronger confirmation may also come from high volume, supportive indicators, or the absence of resistance near the pattern.