Markets often show early signs before changing direction, but they can be easy to miss. The three inside down candlestick pattern is one such signal, appearing after a strong upward move and pointing to weakening buying interest. This post covers how the pattern forms, where it shows up on charts, and how it’s used in reading trend changes.
What is the Three Inside Down Candlestick Pattern?
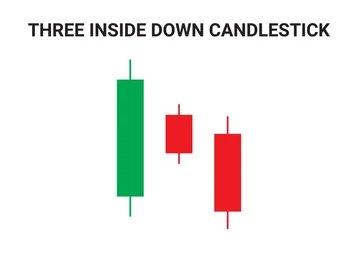
The three inside down pattern is made of three candles and typically follows a bullish price move.First introduced by Gregory Morris, this pattern builds upon the Bearish Harami formation. This pattern suggests weakening bullish momentum and rising bearish pressure. Found in the triple candlestick category, it often appears near potential reversals during an ongoing uptrend.
How is the Three Inside Down Pattern Formed?
The pattern takes shape across three sessions and usually emerges toward the final phase of an uptrend. This is how the pattern forms:
- The first bullish opening candle reflects solid buying strength.
- Next, a second smaller candle fits inside the previous one’s body and ends lower, indicating reduced buying momentum.
- Lastly, the third bearish candle finishes beneath the second, confirming seller dominance.
The pattern looks similar to a bearish Harami, followed by confirmation from the third candle.
Psychology Behind the Three Inside Down Pattern
It signals a steady transition in control from bullish to bearish hands. At first, buyers dominate, seen in the bullish first candle. The second candle, smaller and inside the first, signals uncertainty. By the third candle, sellers push prices lower, confirming their growing strength. This change in control hints at a possible trend reversal and shows how market sentiment evolves over three sessions.
When Does the Three Inside Down Candlestick Appear?
It generally shows up when an uptrend begins to lose steam and price strength fades. The first candle is bullish, showing that buyers are still active. The middle candle opens inside the first’s high-low span and closes down, hinting a change. The third and final candle turns bearish and ends below the second, confirming sellers are in charge. Altogether, this three-day pattern suggests that the uptrend may be fading, making way for a downward shift.
How to Identify the Three Inside Down Pattern
To spot the three inside down candlestick pattern, watch for three specific candles in this order:
- First Candle: A strong bullish candle shows continued buyer interest.
- Second Candle: This forms inside the first candle’s range and closes lower, showing hesitation.
- Third Candle: A red candle finishing beneath the first candle’s low validates bearish momentum.
Collectively, these three candlesticks implies buyer strength is fading while seller control emerges.
What Does the Three Inside Down Indicate in Technical Analysis?
In technical analysis, this pattern is viewed as a sign that the earlier upward movement may be slowing down and that market sentiment is beginning to lean bearish.
Rather than showing sudden panic or sharp reversals, it reflects a gradual loss of buyer strength over three candles. Analysts often see it as part of a broader narrative where confidence in the uptrend weakens and sellers begin stepping in more firmly. It’s not just about the candles, but about recognizing a possible pause or change in market direction after sustained buying pressure.
Is the Three Inside Down Bullish or Bearish?
The three inside down’s nature is of bearish formation, but its structure tells a more layered story. Unlike single-candle signals, this pattern develops gradually over three sessions, offering a visual record of changing market sentiment. What starts as a strong bullish candle shifts into hesitation, followed by a clear move from buyers to sellers. While classified as a bearish signal, it’s not about abrupt collapse, it reflects how confidence in rising prices fades step by step.
Example of the Three Inside Down Pattern
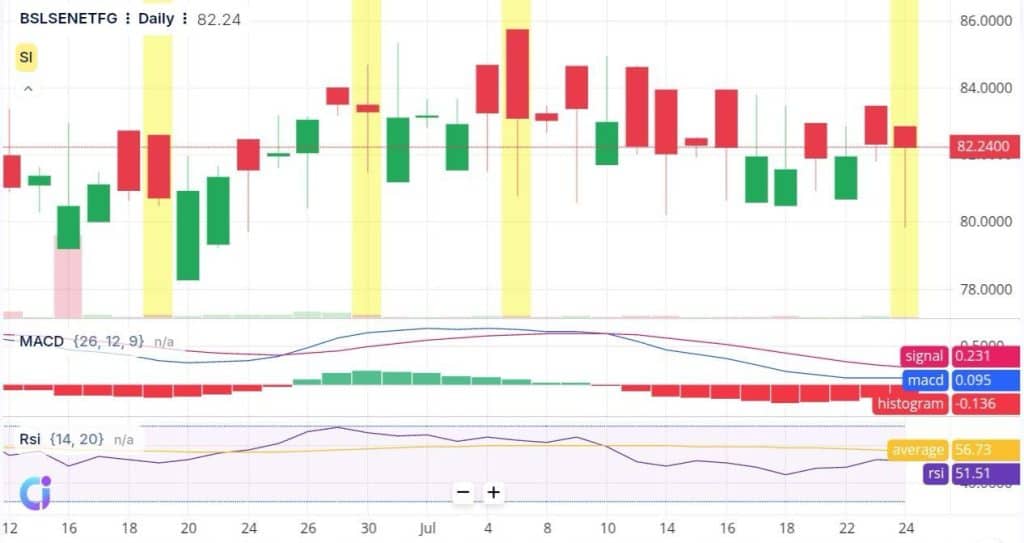
Let’s take a look at the example of Birla Sun Life Sensex ETF on 24 July 2025. The stock slipped by 0.35%. On the chart, you can spot a three inside down pattern, first, a strong green candle, followed by a smaller red candle that stays within its range, and then a third red candle closing below both. This three-step move shows weakening buying strength and a possible shift in short-term sentiment, forming a textbook three inside down candlestick pattern.
How to Trade Using the Three Inside Down Pattern
Here’s how you can trade using this pattern in five simple steps.
- Recognise the pattern: Look for three candles, a strong bullish one, a smaller candle within it, and a final bearish candle closing underneath the second.
- Spot a sequence of three candles: a large bullish candle, followed by a smaller candle (bullish or bearish) that fits inside the first, and finally a bearish candle that closes below the second.
- Wait for confirmation: Ensure the third candle clearly closes lower than the second, as this confirms possible weakening of buying pressure.
- Set a stop-loss: Depending on risk tolerance, it can be placed below any of the three candles, with lower placement often indicating lower risk but smaller reward.
- Book profit: Short positions are typically taken near the end of the third candle or the beginning of the next one, depending on strategy.
- Monitor market conditions: Use this pattern with tools like RSI or moving averages to assess whether the broader trend supports the reversal signal.
Confirmation Tools for the Three Inside Down
To study the three inside down candle stick pattern more effectively, additional indicators can be used such as:
- Exponential Moving Average: EMA tracks average prices with more focus on recent data. If the price moves below the EMA line after the pattern forms, it may reflect growing downward pressure.
- Relative Strength Index: RSI moves between 0 and 100 to indicate if a stock is overbought or not. If the RSI drops below 50 around the pattern, it can reflect a cooling off in buying interest.
- Moving Average Convergence Divergence: MACD applies two EMAs to monitor price momentum. A bearish crossover, where the MACD line crosses below the signal line can support the weakening of earlier price strength.
- Volume: Volume shows how active traders are. A spike in volume on the third candle of the pattern suggests that more participants are aligning with the downward move, lending strength to the price action.
Advantages of the Three Inside Down Pattern
There are multiple reasons why traders might benefit from applying the three inside down formation, such as:
- It visually signals a possible reversal after an uptrend, helping spot turning points early.
- The three-candle structure is easy to identify with basic charting knowledge.
- It becomes more effective when paired with tools like RSI, volume indicators, or support lines for added signals.
- The pattern provides clear price levels for stop-loss placement, which helps in planning risk.
- Can be applied across asset types, equities, indices, or even commodities, wherever technical patterns are tracked.
- Since it develops gradually, it gives time to observe market behavior before acting.
Limitations of the Three Inside Down Pattern
This pattern, though commonly used, comes with its own set of limitations, which include:
- Its reliability shifts across timeframes, what looks clear on a daily chart might be irrelevant intraday.
- Waiting for the third candle as confirmation can delay action in quickly moving setups.
- Interpretation isn’t always easy; even small differences in candle size or position can lead to mixed views.
- The pattern is short‑term; follow‑through typically takes place within a few bars; if it doesn’t, the signal may be invalid.
- There’s no built-in measure of how far the move might go. Traders need additional tools to set targets.
When the Three Inside Down Pattern Fails
This pattern doesn’t always work as expected. It may fail in the following situations:
- The third candle doesn’t close below the first candle’s opening price, which weakens the pattern’s structure.
- The third candle forms on low volume, indicating weak interest from sellers.
- After the pattern forms, price moves up quickly instead of falling, which can point to a false signal or strong buying returning immediately.
Three Inside Down vs Three Inside Up
Although both of these candlestick patterns look structurally similar but indicate opposite directions in price movement. Here’s how they differ:
| Pattern | Three inside down | Three inside up |
| Direction | Indicates a possible price fall | Indicates a possible price rise |
| Structure | Starts with a long bullish candle, followed by a smaller candle within its body, and ends with a strong bearish candle that closes below the second candle | Begins with a long bearish candle, followed by a smaller candle within its body, and ends with a strong bullish candle that closes above the second candle |
Similar Candlestick Patterns to Three Inside Down
These patterns also appear after rising prices and show signs of weakening buying interest:
- Bearish engulfing
This setup occurs when a big red candle fully wraps around the earlier green candle’s body.It indicates that sellers entered strongly after a period of buying, reversing the day’s direction.
Here, a red candle opens above the prior green candle’s close but ends deep within its body. This shows early buying that was overtaken by selling pressure before the session ended.
Conclusion
As trends begin to weaken, the three inside down candlestick pattern can mark the early signs of seller activity. Its formation over three candles helps traders observe momentum loss in a structured way. Paired with other tools, it becomes a helpful addition to any technical analysis setup.
FAQs
The three inside down pattern is a bearish candlestick signal with a large bullish candle, a smaller bearish candle within it, and a third bearish candle closing lower, showing sellers are becoming stronger.
The three inside down pattern can appear on intraday charts, such as 5- or 15-minute intervals. While its structure is the same, the reliability can vary in shorter timeframes. Traders often use this pattern in both intraday and longer-term analysis.
The three inside down pattern is bearish. It signifies that buyers are losing control and sellers are gaining strength, potentially reversing an existing uptrend and turning the market downward.
This pattern is generally viewed as fairly reliable, especially when it forms after a period of rising prices. Some research indicates a moderate success rate, but the pattern is usually used together with other signals or tools for precision.
To confirm, check if the second candle fits entirely within the first upward candle and the third candle closes lower than the second. Extra confidence comes from seeing more trading activity during this sequence or when other technical indicators support the reversal.
The pattern generally offers more reliable signals on longer timeframes such as daily or weekly charts, as signals are less prone to random noise. Still, it is used on intraday charts, though traders are typically more cautious about false signals in shorter periods.
The bearish engulfing pattern has two candles: a large bearish candle that fully covers a smaller bullish one. The three inside down pattern adds a third bearish candle closing below the second, which makes the signal stronger than the basic engulfing pattern.
Beginners can spot the three inside down pattern because of its clear three-candle structure. However, effective use generally requires understanding overall market context and combining it with other analysis, since no single pattern guarantees price direction.
The opposite of the three inside down is the three inside up pattern. This is a bullish reversal pattern that appears after a downtrend, signaling the potential for an upward move, with a bearish candle followed by two bullish candles.