
Not every market move carries meaning. Sometimes, a steady rise after a decline hints at more than just recovery. The real insight lies in how that price behaviour fits within the broader picture. Before you make it a part of your trade plan, make sure to understand what it really suggests. Let’s break the Three White Soldiers pattern down and see what really matters.
What is the Three White Soldiers Candle Pattern?
It is a three-candled bullish reversal signal. It usually forms after a bearish phase and suggests a possible reversal in market sentiment to bullish. Traders use the candlestick pattern to identify a potential change in direction, where buying interest may start to edge selling pressure.
How are Three white soldiers Candlestick Formed?
The pattern develops across three trading sessions and typically emerges after a downward trend.
- The first candle displays strong bullish sentiment with a full body and minimal shadows.
- The second one maintains this strength, opening within the last’s range, but closes with a solid move up.
- The third confirms the sequence, continuing the rise and closing above the second candle’s high, reinforcing the momentum.
How to Spot a Three White Soldiers Pattern
This formation usually emerges after a period of sustained decline, where selling begins to ease & buyers gradually return.
Look for these characteristics on the chart:
- Start by scanning for three consecutive green-bodied formations.
- Each one opens inside the last body and climbs to the previous high or beyond.
- Shadows, if present, remain short and subdued.
- The overall structure should show a steady rise with little price rejection.
What Does the Three White Soldiers Pattern Indicate?
This formation typically appears after an extended period of decline, hinting at a shift in market control. Consecutive strong closes, each holding near the upper range, indicate that selling interest has faded.
Occasionally, it follows earlier signs of pause, such as a hammer or a doji. Overall, it signals growing optimism in the market. However, interpretation should never rely on a single chart structure. Additional methods of evaluation and prudent risk handling are essential before any position is taken.
What Does the Candle Colour Tell in the Three White Soldiers Pattern?
Although the pattern mentions ‘White Soldiers’, depending on the charting platform, the candles may appear in white or also in green. However, the colour doesn’t hold any technical significance. But what matters is the consistent upward price action and structure of the pattern, not the visual shade used to display it.
How often does Three white soldiers Candlestick occur?
The pattern is relatively uncommon, since it needs three strong green candles in a row. Moreover, the frequency also depends on the market and time frame analysed. In general, its appearance is more often during strong upward trends or high volatility but is not a regular occurrence.
How to read Three white soldiers Candlestick in Technical Analysis?
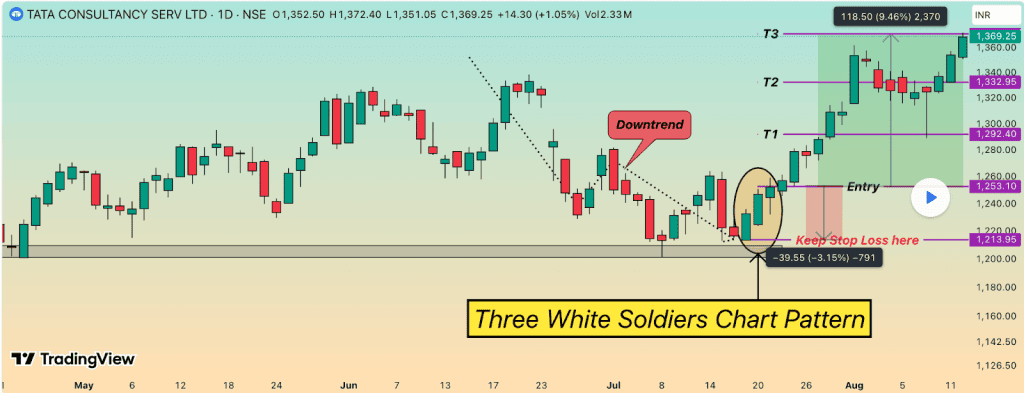
This setup often follows a clear downtrend. For example, in the technical analysis of TCS, this pattern appeared around ₹1213 after a price dip. What followed were clean moves to ₹1232, ₹1246, and ₹1252. In this context, the structure captured a clear shift in behaviour rather than just a visual formation.
How accurate are the Three white soldiers Candlestick in Technical Analysis?
Its reliability varies with market context and supporting indicators. However, alone, the signal does not confirm future direction. It may signal stronger insight when aligned with other factors like volume trends or key support levels. The accuracy tends to drop in sideways or low-volatility conditions. Used in isolation, it can mislead during short-term corrections. Broader confirmation is essential for informed interpretation.
How to Trade with Three white soldiers Candlestick in Stock Market?
- Identification: Look for the pattern after a decline. Each candle should build on the last without hesitation.
- Assess the volume: A gradual rise in traded quantity supports the move, suggesting genuine buying interest.
- Time the entry: In general, traders often consider entering after the final candle closes, once strength is clearly established.
- Manage downside risk: A common approach is to place a stop below the low of the first candle to limit downside if the trend does not continue.
- Plan the exit: Review nearby resistance or weakening momentum to select a suitable point for locking gains.
Three White Soldiers Trading Strategy
The case for the formation of three white soldiers becomes stronger when it aligns with any of the following strategies:
- Exponential Moving Average
EMA is a line that shows the average price over time, that helps to identify the direction of a trend. Now, when the second candle in the Three White Soldiers pattern closes above the EMA, it may suggest growing bullish momentum. If the third candle stays above or takes support on the EMA, the signal is considered stronger.
- Relative Strength Index
It helps to gauge whether buying or selling pressure is building up. Hence, when the Three White Soldiers appear and the RSI moves upward at the same time, it strongly indicates the growing bullish momentum. Hence, traders often look for confirmation from RSI movement before entering.
- Moving Average Convergence Divergence
MACD helps to understand the strength behind price moves by comparing short and long-term trends. When the Three White Soldiers pattern appears and the MACD also shows an upward move, it can confirm that the trend is supported by momentum.
What are the advantages of the Three white soldiers Candlestick Pattern?
- Highlights behavioural change: The pattern can signify a change in market psychology, allowing traders to observe how optimism may build after a decline.
- Reveals underlying intent: Wider recognition can lead to herd behaviour, but careful volume analysis may reveal if large players are active or exiting.
- Supports short-term strategies: On higher timeframes, it may signal movement strong enough to create intraday opportunities on smaller charts.
What are the disadvantages of Three white soldiers Candlestick?
- Late entry risk: By the time the third candle forms, a large part of the move may be over, especially near key resistance levels.
- Overconfidence bias: Its clarity can lead traders to ignore other signals, driven by urgency or by FOMO- the fear of missing out.
- Tactical vulnerability: Predictable reactions may attract institutional counter-moves, using retail expectations to manage their own exits.
What is the Opposite of Three white soldiers Candlestick?
An inverse formation is called the Three Black Crows. It typically emerges after a rising phase and suggests increasing downward pressure. The structure consists of three declining candles, each opening within the prior range and closing progressively lower.
What is the difference between Three white soldiers and Three Black Crows?
Here’s how Three Black Crows differ from the Three White Soldiers:
| Feature | Three White Soldiers | Three Black Crows |
| Trend direction | Signals a possible move up | Points to a potential drop |
| Where it forms | After a downward stretch | Near the top of an uptrend |
| Candle behaviour | Three solid green/white candles, each closing higher | Three steady red/black candles, each closing lower |
| Wick length | Small or no upper wicks | Small or no lower wicks |
| What it implies | Buying momentum is building | Selling pressure is gaining pace |
| What to watch | Overhead resistance might slow gains | Distance from recent highs can stretch risk |
What Candlestick Pattern is Similar to Three white soldiers Candlestick?
Several bullish patterns share directional intent but differ in structure, timing or market context.
- Bullish Engulfing: This two-bar formation shows a complete reversal of control, where a strong candle overtakes the previous session’s range.
- Morning star: It is a three-candle setup, but includes a small-bodied candle between decline and recovery.
- Piercing line: Formed across two sessions, it begins with a bearish close, followed by a strong recovery that reclaims lost ground and crosses mid-range.
Three white soldiers pattern examples
The three white soldiers pattern is a bullish candlestick formation that signals a strong potential trend reversal from bearish to bullish. It consists of three consecutive long green candles, each closing higher than the previous one, with relatively small shadows.
Here are a few common examples to understand it better:
Example 1: Reversal after a downtrend
A stock has been falling for several weeks due to weak sentiment. Suddenly, three strong green candles appear one after another, each opening near the previous day’s close and closing higher. This shows buyers stepping in aggressively and often marks the start of a new uptrend.
Example 2: Breakout from consolidation
After moving sideways in a narrow range, a stock forms three white soldiers. Each candle closes near its high, indicating sustained buying interest. This often signals a breakout with follow-through momentum, especially when supported by higher volumes.
Example 3: Recovery after a sharp correction
Following a sharp market correction, a stock prints three white soldiers over three sessions. This suggests confidence returning to the market and that sellers are losing control. Traders often view this as a confirmation of trend recovery, not just a short-term bounce.
FAQs
The structure suggests upward intent. It often forms after a period of selling pressure. Each candle closes higher than the last. That steady rise may point to growing interest from buyers. Some view it as a shift in control. Others wait for confirmation before acting.
Its reliability depends on context. Some traders find it more useful when supported by volume. Others prefer additional signals before acting. It may work well in trending markets. In choppy conditions, results can vary. No pattern offers certainty. Reading it in isolation may lead to missed cues.
It typically points to upward strength. Each bar closes above the one before it. That sequence often follows a downtrend. Some see it as a sign of buying pressure. Others view it as temporary recovery. Context remains key to understanding intent.
It can appear on short-term charts. Some intraday traders use it to spot possible reversals. The pattern may form during strong price moves. Others prefer it on longer timeframes for clarity. In fast markets, it may give mixed signals. Reading it with volume and pace helps refine the view.
The three white soldiers pattern has a success rate of around 60–70%. It works best after a downtrend and with strong volume confirmation.
Fair value gaps trading focuses on price gaps formed by sharp moves. Traders expect price to revisit these gaps before continuing the trend, using them as potential entry zones.
The 3 Green Soldiers candlestick pattern refers to three consecutive bullish (green) candles that open within the previous candle’s body and close higher each time. It signals strong buying momentum and often indicates the start of an uptrend after a downtrend.
Three Little Soldiers is another informal name for the Three White Soldiers pattern. It describes three steady bullish candles with small wicks, showing controlled and consistent buying pressure.
“Three White Knights” is not a standard technical term, but it is sometimes used informally to describe the Three White Soldiers pattern. It represents three strong bullish candles indicating a potential reversal from bearish to bullish trend.
The Marching Soldiers pattern typically refers to the same concept as Three White Soldiers — three consecutive bullish candles moving upward in a step-like formation, reflecting sustained buying strength and upward momentum.