Have you ever noticed how prices sometimes burst above those upper lines on Bollinger Bands and wonder if it’s time to jump in? That’s exactly what an Upper Bollinger Band Breakout signals: momentum shifting, buyers taking control, and possibly a fresh rally beginning. However, not every close above the band conveys the entire story.
Let’s explore what an upper band breakout tells us, how to check if it’s the real deal or just noise, and how you can trade it with more confidence.
What is the Upper Bollinger Band Breakout?
An upper Bollinger Band breakout occurs when the price closes above the upper bollinger band, indicating strong bullish momentum or an overbought condition. which is a band drawn above a moving average by a measure of volatility (typically two standard deviations), this is called the Upper Bollinger Band Breakout.
This breakthrough frequently means that more people are purchasing, and the market is getting more volatile. But it is a bit like a roaring lion; it can either be the start of a big move or just a loud noise before the market settles back.
How Does the Upper Bollinger Band Breakout Work?
Bollinger Bands are like a band that wraps around the price. When things are peaceful, they are tight, but when things go rough, they get bigger.
If the price goes above the upper band after a calm or “squeeze” period, it means the market is waking up and changing gears. But hold back from jumping in too fast. Sometimes price shoots up only to drop just as quickly, and staying sharp during those moments is key to trading with control.
How to Identify an Upper Bollinger Band Breakout
Here’s what you want to see to separate the signal from noise:
- Bands have been tight, signaling low volatility.
- Price closes clearly above the upper band, not simply for a short time.
- Volume rises on the breakthrough candle, which means that traders are buying in.
- The breakout fits with the bigger trend, not against it.
- Confirmation by a close (end of candle), not just a wick piercing the band.
Best Indicators to Use with Upper Bollinger Band Breakout
Use these indicators to confirm signals and avoid false breakouts:
- Volume: If volume spikes noticeably on the breakout, it’s a strong sign.
- RSI: If RSI is rising but not yet overbought, it’s a good green light.
- MACD: A bullish crossover supports the idea that momentum is shifting.
- Moving Averages: Price above 50-day or 200-day moving averages means the trend backs the breakout.
Combining RSI with Bollinger Band Breakout
RSI helps measure momentum strength and possible exhaustion. For healthier breakouts:
- Aim for RSI between 50 and 70.
- If RSI is above 70 right at the breakout, understand it might be overstretched.
- If it’s climbing from below 50 with a breakout, that can confirm strength.
Using Moving Averages with Bollinger Bands
Moving averages smooth out price action. When price breaks above the upper band and remains above a key moving average, your odds improve. Conversely, breakouts below major MAs should be treated cautiously as they sometimes fail against the trend.
Upper Bollinger Band Breakout Trading Strategy
Here’s a simple step-by-step plan:
- Scan for setup: Find stocks or pairs where the price has been in a steady trend and the bands aren’t too wide.
- Wait for breakout: Enter when a candle closes fully above the upper band, with volume above the recent average.
- Set stop loss: Place it just below the middle band or the recent swing low, where you’d be wrong about momentum.
- Define target: Aim for a reward at least twice your risk. You might measure the prior range or use a fixed point target.
- Trail your stop: As price moves higher, move your stop just under each new swing low or under a rising moving average.
This keeps you in a winning trade as long as the market shows strength, and out when it doesn’t.
Example of an Upper Bollinger Band Breakout Trade
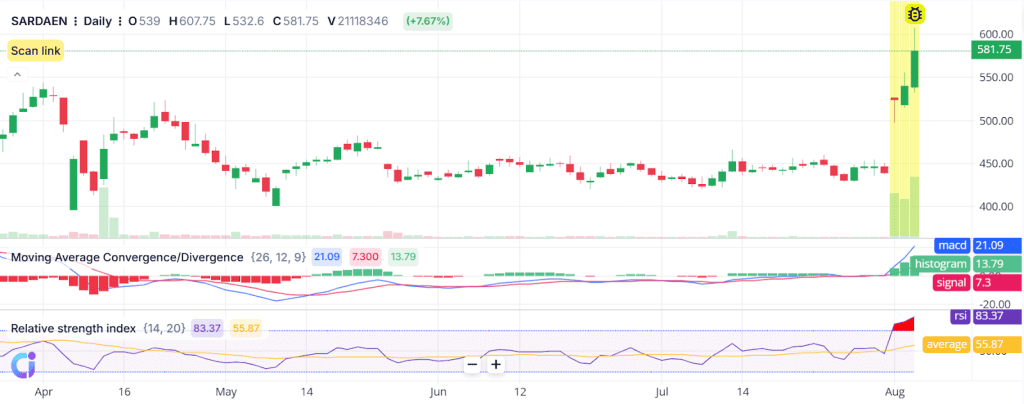
A clear example of an upper Bollinger Band breakout can be seen on the SARDAEN daily chart in early August. Before this, the stock moved sideways for weeks, with the price staying in a tight range. During this time, the Bollinger Bands would have narrowed, a common sign of low volatility and a possible setup for a bigger move.
As August begins, the price suddenly surges with strong green candles. On the breakout day, the candle closes well above the upper Bollinger Band. What makes the move more reliable is the spike in volume; more buyers are stepping in.
Momentum tools also support the move. The RSI shoots above 80, showing strong momentum, though nearing overbought levels. The MACD line crosses well above the signal line, and the histogram expands, both bullish signs.
If you entered on the breakout candle, your checklist would look like this:
- Entry trigger: Candle closes strongly above the upper band, backed by rising volume
- Momentum support: Both RSI and MACD confirm strength
- Stop loss: Set below the breakout candle or close to the middle of the Bollinger Band
Over the next few sessions, the stock keeps going up, rewarding traders who were patient and waited for a clean breakthrough with strong signals.
This example explains why upper Bollinger Band breakouts perform best when they come after a quiet time, break out strongly, and have momentum on their side.
Common Mistakes to Avoid with Bollinger Band Breakouts
- Chasing spikes: Jumping in on the highest candle wick often means you’re late.
- Ignoring volume: If volume is weak, so is the breakout.
- Overleveraging: Big stops or large position sizes can blow you out on small reversals.
- Trading against major trends: Breakouts in the upper band during a downtrend frequently don’t work.
- No Risk Plan: Always use stops, markets can snap back quickly after a breakout, especially in volatile conditions
Upper vs Lower Bollinger Band Breakout
| Feature | Upper Band Breakout | Lower Band Breakout |
| Signal | Bullish, price breakout | Bearish, price breakdown |
| Usage | Buy signals in rising markets | Sell signals in falling markets |
| Common Pitfalls | Overbought traps, quick reversals | Oversold bounces, false breakdowns |
| Best Confirmation | Volume surge, RSI and MACD alignment | Volume confirmation, RSI below 50 |
Conclusion
An upper Bollinger Band breakout might be a dependable strategy to spot fresh uptrends early. If you combine clear close-above-band signals with volume, RSI, and moving averages, you will have the best chance of riding true momentum.
Don’t trade too much, keep your stops close, and create targets that are possible to reach. This easy method can become a formidable tool in your breakout trading toolkit with practice.
FAQs
When the price moves above the upper Bollinger Band, it suggests that the market is headed up fast. It can advocate that a new bullish trend is starting, especially after a time of calm. But alone, this move doesn’t always mean a trend is beginning.
Your trading style will determine the appropriate time frame. Charts that show 5 or 15 minutes are good for trades that happen during the day. For swing trading, daily charts are better. A longer time frame minimises noise and makes breakout signals more dependable.
Yes, it is often considered a bullish signal. Price breaching above the upper band suggests purchasing pressure is high. But to get a better idea of what’s going on, utilise it with volume, RSI, or MACD to evaluate if the move is resolute.
Yes, utilising RSI with Bollinger Bands helps validate indications. If the price goes above the top band and the RSI goes up but isn’t overbought yet, it suggests a bullish stance. If the RSI is excessively high, the breakthrough might not last long.
If volume and momentum indications back it up, it can be trusted. Breakouts that happen during the day happen quickly; thus, traders need to be able to make decisions quickly. Use support indicators like RSI, MACD, or moving averages to screen out weak or fake breakouts.