Not every price gap signals something meaningful and that’s where many traders get stuck. Misinterpreting gaps often leads to false entries or missed setups. The upside tasuki gap is one of those lesser-known candlestick patterns that can act as a guide when price resumes its upward path. In this blog, we will take through its meaning, what it looks like and how it can effectively be used in a trading strategy. Let’s get to it then!
What is an Upside Tasuki Gap?
An upside tasuki gap is a three-candle price gap pattern seen on candlestick charts. It begins with a strong upward candle, followed by a gap up and then a small downward candle that doesn’t fully close the gap. Traders watch for this pattern because it may reflect continued buying interest after a pause. The gap staying open is seen as a sign that selling pressure hasn’t taken over.
How Does an Upside Tasuki Gap Form?
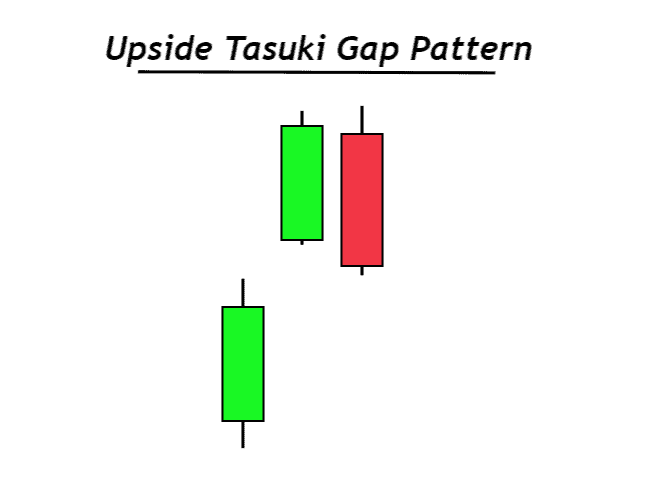
The formation involves three specific candlesticks in sequence:
- First candle (bullish): This is a large green candle showing strong upward price movement, often with a gap from the previous session, suggesting buying strength.
- Second candle (bearish): A small red candle appears next, pulling back slightly into the gap but not closing it. This hints at profit-booking or short-term reaction.
- Third candle (bullish): Another green candle closes above the open of the second candle, indicating buyers are active again and maintaining pressure.
Together, these candles suggest that the upward move is intact despite a minor pullback.
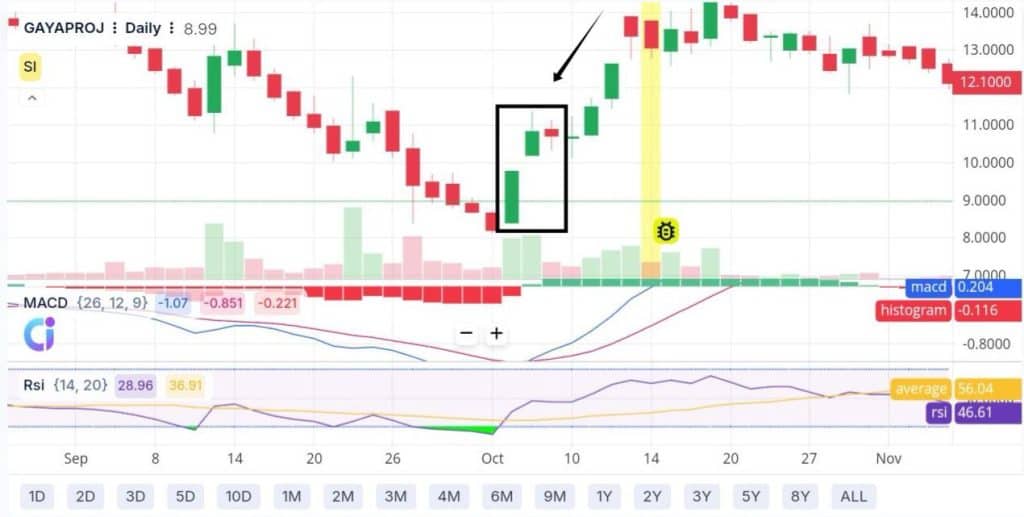
For example, in the daily chart of Gayatri Projects Limited, an upside tasuki gap appears in early October 2022. A strong green candle is followed by a mild red pullback, and then another green candle resumes the move, forming the classic three-candle sequence. This displays continued buying interest after a brief pause.
What Does the Upside Tasuki Gap Indicate?
Each candlestick tells a story about market behavior. When an upside tasuki gap forms, it often reflects how buyers and sellers reacted during that time. The market starts off strong, already in a rising phase, and the first candle shows a firm upward move. On the next day, the market opens higher and continues climbing, forming the gap. After two strong sessions, concerns about high prices start to build, and sellers begin to act. This creates a red candle that closes below the second candle’s open. But it doesn’t break the gap area, suggesting that this pullback didn’t change the broader buying interest. Buyers step back in, and prices rise again, continuing the earlier direction.
Trading the Upside Tasuki Gap Pattern
This candlestick pattern is usually seen as a pause during an upward price move. Steps to trade it include:
- Spot the pattern: Look for two green candles with a gap between them, followed by a red candle that closes into the gap but doesn’t fill it completely.
- Plan the entry: Consider entering near the close of the third (red) candle or when the next candle starts moving upward. This is treated as a sign that selling may be ending.
- Set a stop-loss: Place a stop-loss just below the low of the first green candle or beneath the gap. A close below this can signal that the pattern may not hold.
- Define the target: Choose a previous resistance level or use a risk/reward ratio (like 1:2 or 1:3) based on your entry and stop-loss levels to mark a possible exit.
Confirming the Upside Tasuki Gap with Indicators
Some confirmation tools help add clarity to this gap-based pattern are as follows:
- Volume
Volume measures how much of an asset is being traded during a specific time. In the upside tasuki gap, strong volume on the first two green candles shows active buying, while a pullback on lower volume suggests the drop is temporary. A rise in volume during the next upward move can support the continuation view.
- Relative strength index (RSI)
RSI is a momentum-based technical indicator that compares recent gains to losses over a set period. When the RSI is above 50 but below 70 during the pattern, it signals upward pressure without indicating overbought conditions, aligning with the idea of a brief pause before prices rise again.
- Exponential moving average (EMA)
EMA gives more weight to recent price movements, making it more responsive to short-term changes. If the upside tasuki gap forms above core EMAs like the 20-day or 50-day line, it adds confidence to the setup by showing that prices are staying above recent dynamic support levels.
Upside Tasuki Gap vs Downside Tasuki Gap
The upside and downside tasuki gap patterns are opposite in structure and meaning. One appears in rising prices, and the other during falling prices. Here’s how they differ:
| Feature | Upside tasuki gap | Downside tasuki gap |
| Market trend | Uptrend | Downtrend |
| Signal type | Bullish continuation | Bearish continuation |
| Formation | Two bullish candles gap up, followed by a bearish candle closing in the gap. | Two bearish candles gap down, followed by a bullish candle closing in the gap. |
Related Candlestick Gaps and Patterns
Some other patterns that use gaps combinations to showcase market behavior are as follows:
- Breakaway gap: This gap forms at the beginning of a strong price move, often breaking out from a period of sideways movement. It marks a clear shift in market interest, usually seen with a spike in volume.
- Continuation gap: Also known as a runaway or runaway gap, the continuation gap appears during an ongoing move, often after a short pause. It signals that buyers or sellers are still active and that the direction is holding steady.
- Measuring gap: Often found in the middle of a strong price swing, this gap is used to estimate how much further the price might move. It divides the overall move into two legs of similar size.
Advantages and Limitations of the Upside Tasuki Gap
Upside tasuki gap pattern has many benefits, but also certain drawbacks that limit its standalone reliability.
Pros:
- The three-candle formation with a visible gap makes the pattern easy to spot without relying on complex setups.
- It offers clear price levels for entry and stop-loss placement, often using the gap as a reference.
- The structure helps in identifying temporary pullbacks within a broader upward move.
- It can be used alongside basic tools like volume or RSI to support decision-making.
- The gap often reflects a shift in short-term demand and supply, giving an insight into immediate market behavior.
- When followed by strong price action, it may allow traders to rejoin the ongoing upward leg with better timing.
Cons:
- The pattern is relatively rare, reducing the number of usable opportunities in live charts.
- It can be visually mistaken for similar patterns like the upside gap three methods, which signal the opposite movement.
- In some cases, the third candle does not halt at the gap and continues falling, reversing the initial setup.
- Without support from indicators or price structure, the pattern alone may give misleading cues.
- Backtesting studies have shown mixed performance, with results varying across asset classes and timeframes.
- It requires confirmation from surrounding price behavior, making it unsuitable for quick or isolated decisions.
- False positives can occur in highly volatile sessions where gap formations are frequent but unreliable.
Conclusion
Not all gaps carry the same weight. The upside tasuki gap is one that draws attention due to its clean setup and the way it reflects price resilience. Recognizing this formation, along with indicator tools can help bring more structure to chart reading. Still, it’s important to view it as one piece in the larger puzzle of price analysis.
FAQs
The upside tasuki gap forms in an uptrend with two bullish candles and a bearish candle that does not close the gap, signaling bullish continuation. The downside tasuki gap is its bearish mirror, forming during a downtrend with opposite candle colors.
The upside tasuki gap is considered moderately reliable in strong uptrends, especially in stocks or futures with natural gaps. However, false signals are possible in weak trends or low-liquidity markets, so confirmation with other tools is recommended.
Beginners can identify and use the upside tasuki gap, since its structure is clear. However, it is best to wait for additional confirmation before acting, as the pattern alone does not guarantee a successful trade.
Moving averages (like the 50-day or the 200-day), momentum indicators such as RSI or MACD, and volume analysis often work well with the upside tasuki gap. Using these with the pattern can help confirm trend strength and reduce false signals.