Table of contents
Have you ever wondered whether stocks and indices move together? Like, if Reliance goes down, will SENSEX follow? With so much market data available these days, financial analysts constantly look for ways to understand the intricate relationships between different securities and indices. This is where a concept called correlation comes in.
Correlation essentially measures how much two securities or indices move together. When the correlation is high, it indicates a greater probability of the components moving concurrently.
But what if you could gauge not just how two investments move together historically, but how the market expects them to move in the future? Enter the implied correlation index, a powerful tool that can unlock valuable insights for investors and options traders.
This article will break down this concept in a way that is easy to understand, even for financial newbies.
What is an implied correlation index?
The fluctuation in an index’s value is primarily driven by two key elements:
- The inherent volatilities of the index’s individual components and
- The correlation or the degree of relatedness in the price returns of these components.
So, it is logical to assume that if the implied volatilities (This is like a forecast of how much the price of something like a stock or index might go up or down) of the components of the index increase, so would the implied volatility of an index option.
In some cases, the index option’s implied volatility might vary, even if the implied volatilities of its components remain unchanged. Here comes the role of the implied correlation index.
But what is an implied correlation index?
In 2008, the Cboe Options Exchange unveiled the implied correlation index, a financial benchmark that measures the anticipated average correlation of price returns for S&P 500 components. This is inferred from the prices of SPX index (symbol referring to the S&P 500 index) options and the prices of single-stock options on the 50 largest stocks of SPX.
This index, which serves as a measure of market herd behaviour, predicts future diversification benefits by measuring the expected average correlation among the top 50 stocks in the SPX index.
This implied correlation is valuable information for traders as it indicates how closely the index’s components are moving in relation to each other.
Here’s the Cboe S&P 500 implied correlation index chart:

This tool also helps identify drivers of index implied volatility. It evaluates major macroeconomic shocks’ implications on market expectations.
How is the Implied Correlation Index calculated?
The Implied Correlation Index measures how two assets are expected to move together, based on their implied volatilities. It’s typically calculated using the Black-Scholes model, comparing the volatility of each asset and their combined option prices.
Implied Correlation Formula
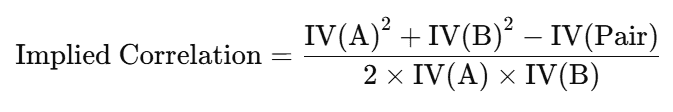
Where:
- IV(A) and IV(B) are the implied volatilities of Asset A and Asset B.
- IV(Pair) is the implied volatility of a combined option (pair or basket).
Example of Implied Correlation
For Stock A with IV = 20%, Stock B with IV = 15%, and a combined option with IV = 18%, the implied correlation is:
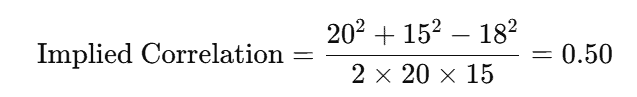
This indicates a moderate positive correlation between the stocks.
Strategies for Implied Correlation Index
- Arbitrage: Profit from mispricings when correlation is higher or lower than expected.
- Hedging: Use implied correlation to hedge stocks or sectors expected to move in tandem.
- Directional Betting: Bet on stocks’ movements—low correlation suggests divergence, high suggests convergence.
- Volatility Spreads: Set up spreads when implied correlation changes, taking advantage of volatility shifts.
What is the purpose of the implied correlation index?
The implied correlation index serves as a tool for traders to understand the correlation among the components of an index. This understanding is crucial as the index’s change in a day could be due to all components moving in the same direction (high correlation) or an equal number of components moving in opposite directions (low correlation).
The correlation is a measure of the diversification benefit that a financial investor expects when constructing a portfolio. A decrease in correlation reduces the portfolio’s overall volatility, improving the risk/return tradeoff for the investor.
When positive correlation surges, it suggests a reduction in anticipated diversification advantages, systematic risk, and an increased probability of encountering severe occurrences linked to abrupt market shifts.
Similarly, dispersion, like correlation, quantifies diversification benefits. It measures the spread between the average variance of component securities and portfolio variance.
Dispersion trading is a strategy that monitors shifts in correlation levels and assesses the comparative affordability of index options versus a collection of component options. Therefore, the implied correlation index is crucial in these trading tactics.
Who are the users of this index?
Two key groups utilise the implied correlation index: investors and options traders.
- Investors use this index to assess the diversification benefits of their portfolio. A high implied correlation might prompt them to adjust holdings, including assets with a low correlation.
- Options traders depend heavily on implied correlation data, aiming to grasp market volatility and make informed decisions. During periods of high values, they might prefer tactics that take advantage of rising volatility.
In summary
The implied correlation index might sound complex, but it is a tool that helps us understand how different investments move together.
By using this index, investors can make smarter decisions about diversification, and options traders can navigate the sometimes choppy waters of the market with more confidence.
FAQs
In 2008, the Cboe Options Exchange unveiled the implied correlation index, a financial benchmark that measures the anticipated average correlation of price returns for S&P 500 components. This is inferred from the prices of SPX index options and the prices of single-stock options on the 50 largest stocks of SPX.This index predicts future diversification benefits by measuring the expected average correlation among the top 50 stocks in the SPX index.
The implied correlation measures the correlation between components of the SPX index on average. To find the implied index value, the correlation term gets isolated: First, the difference between the implied variance of the SPX option and an uncorrelated portfolio of the top 50 SPX components by market capitalisation is calculated. This value, then divided by the sum of weighted implied volatility products of pairs, gives the implied correlation value.
The implied correlation index or model is a financial benchmark that measures the anticipated average correlation of price returns for S&P 500 components. This is inferred from the prices of SPX index options and the prices of single-stock options on the 50 largest components of the SPX.
This index predicts future diversification benefits by measuring the expected average correlation among the top 50 stocks in the SPX index.
Dispersion and correlation are two different statistical measures. Dispersion measures the spread or variability in a set of data. We can say it is the average difference between the index’s return and the return of each of the index’s components. Whereas correlation measures the degree to which two variables move in relation to each other. It is a measure of timing. So, while correlation is about the synchrony of movements, dispersion is about the magnitude of differences.
Correlation refers to a statistical relationship between two variables. A positive correlation tells that both variables either go up or down together, while a negative correlation indicates that one variable goes up as the other goes down.
But remember, correlation is not the same as causation; a correlation between two variables does not necessarily mean that the changes in one variable cause the changes in another. Further research should be done to establish causation.
SPX correlation refers to the relationship between the S&P 500 index (SPX) and other assets or indices. A high correlation means the asset tends to move in the same direction as the S&P 500, while a low correlation indicates a less predictable or divergent relationship.
The CBOE Correlation Index measures the correlation between the S&P 500 Index and its constituent stocks, reflecting how closely individual stocks are expected to move in relation to the overall index. A higher value suggests stocks are moving in sync with the index.
CBOE implied correlation is the market’s expectation of the correlation between the S&P 500 and its individual stocks, derived from options prices. It estimates how much stocks within the index are expected to move together, based on implied volatilities from options trading.