The market always leaves evidence behind, and the double bottom pattern is one of them. This is a signal that usually appears when a downtrend begins to lose its strength and the buyers walk in.
The double bottom pattern emerges when the price tests a support level twice and fails to decline further, suggesting that the selling pressure may be exhausted. Such formations are of practical importance, as they assist in recognising possible shifts in momentum. A clear understanding of this pattern allows for improved trade planning and measured risk assessment.
The discussion that follows will examine the structure of the double bottom pattern, indications, identification methods, real-world illustrations, and a balanced view of its merits and limitations.
What is a Double Bottom?
According to John J. Murphy, in Technical Analysis of the Financial Markets, the double bottom is a major reversal pattern that signals the potential end of a prior downtrend. This is a pattern consisting of two well-defined troughs occurring at approximately the same price level, separated by an intervening rally.
The first bottom emerges as the price declines and finds a temporary support. A subsequent advance follows, forming a reaction high. Thereafter, price declines once more toward the prior low. When this second decline fails to break decisively below the first trough, it suggests that the prevailing selling pressure is diminishing.
The pattern, however, is confirmed only when the price rises above the peak formed between the two lows. This breakout indicates that buyers have gained control and that a new upward trend may begin. In contrast, a double top pattern represents the opposite structure, forming after an uptrend and signalling a potential downward reversal.
Indications of the Double Bottom Chart Pattern
The double down pattern indicates a significant reversal of an existing downtrend to an upward movement.
- Exhaustion of selling pressure: When the price fails to break below the first low during the second decline, it suggests that sellers are losing control.
- Strong support zone: The repeated defense of a particular price level reflects the presence of stable buying interest.
- Emerging buyer confidence: The rally following the second bottom shows that demand is gradually overcoming supply.
- Trend reversal: Once the price moves above the intermediate resistance level, the pattern indicates the possibility of a new upward trend.
Real-World Example of Double Bottom Pattern
Here’s an example of double bottom pattern formation on the 2-hour chart of Trent Limited (NSE), as of 11 February 2026.
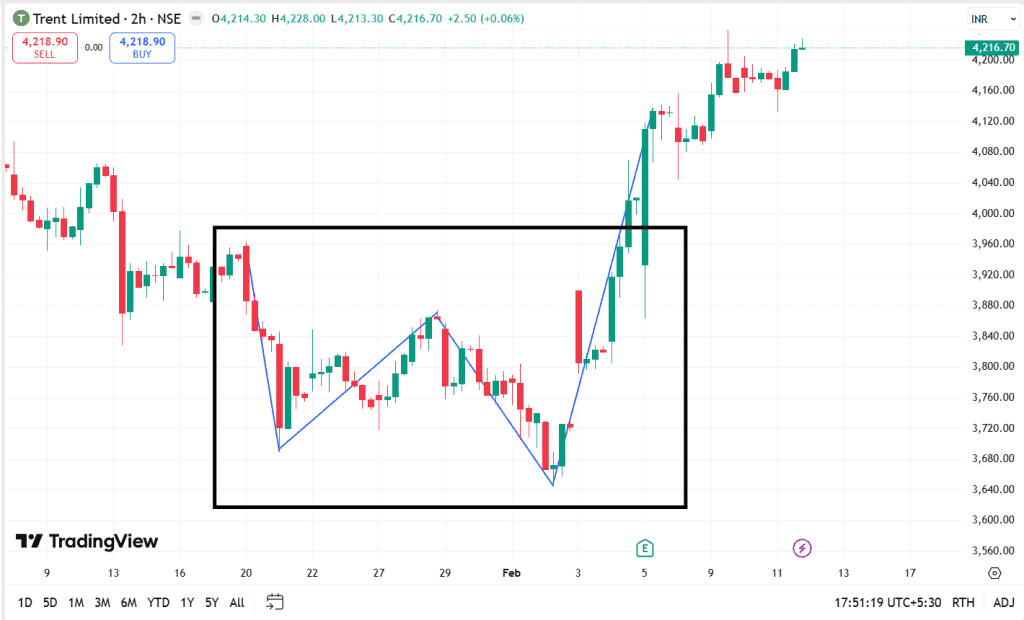
On this chart, we can see that the price declined and formed its first low at ₹3,700 around 21 January, followed by a recovery toward ₹3,850–₹3,900, forming the neckline. Thereafter, price declines again in early February, marking a second trough near ₹3,650–₹3,700. The second low does not materially undercut the first, indicating waning selling pressure.
The confirmation occurs when the price advances above the neckline region near ₹3,900–₹3,950 with strong bullish candles. This breakout signals a transition from distribution to accumulation, thereby completing the double bottom formation and implying an upward trend.
How to Identify a Double Bottom Pattern
Look for the following signs while identifying a double bottom pattern:
- Pattern
In a double bottom pattern, you will be able to observe two troughs or bottoms of approximately the same height with a peak or high point in between.
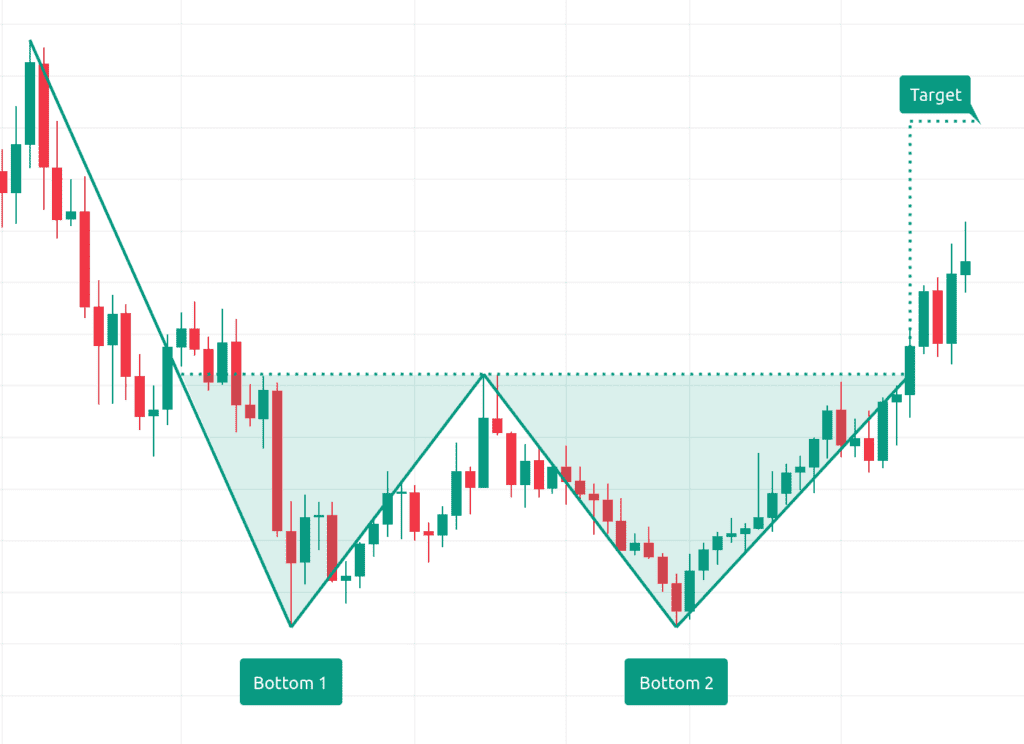
The troughs need not be identical but must ideally be within 3-4% of each other. These together will look like the letter W. It is essential to ensure that the time between the two troughs is not too long, as that could imply that the bullish trend reversal is not gaining momentum.
- Previous downtrend
A relatively long period of a downtrend (during which the price keeps falling) precedes a double bottom pattern. The downtrend is crucial for the possibility of an uptrend after the pattern.
- Volume
Tracking volume during the pattern’s formation can help you assess if there will be an uptrend after the double bottom pattern. Ideally, trading volumes should be high when the first bottom is formed. A decrease in trading volume should follow when the peak is formed. Then again, trading volume should increase during the formation of the second trough, and the volume during the second trough should ideally be higher than during the first.
- Neckline
Draw a straight line across the peak, as shown in the image below. It is known as the neckline. If the stock price rises above the neckline level, it can be taken as a sign that a double bottom pattern has formed, and there is a chance for a price reversal from a downtrend to an uptrend.
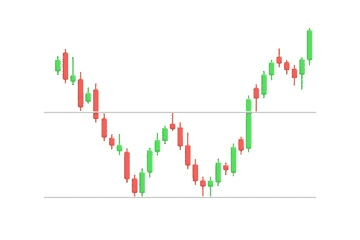
In this image, the line on top is the ‘neckline.’
- The time between the troughs
The word ‘timeframe’ in this context refers to the duration between the formation of the first trough and the second one. The shorter the timeframe, the more the likelihood of a reversal toward an upward trend.
Must the Two Bottoms of the Lows in the Double Bottom Pattern Be the Same?
The two bottoms of the lows in a Double Bottom Pattern need not be exactly the same in price.
The second bottom usually forms ‘near’ the first level, but the exact equality is not required. In practice, markets rarely produce perfect symmetry. What is important is that the second decline approaches the prior low and fails to break below it.
A slight penetration of the first low may even occur. However, such a brief move below support, followed by a quick recovery, does not invalidate the pattern. Instead, it may represent a temporary shakeout of weak holders.
Thus, the emphasis is placed on the market’s inability to sustain a new low, not on identical price points. The pattern is confirmed only when the price advances above the intervening high, signaling that the buying pressure has overcome selling pressure.
Benefits of the Double Bottom Pattern
The double bottom pattern offers practical advantages to traders and investors who want to identify potential trend reversals with discipline.
- Reversal signal: The pattern is a structured indication that a prior downtrend may be ending, which assists in acting with greater confidence.
- Defined risk levels: The pattern naturally establishes a clear support zone at the two lows, which helps in placing stop-losses with logic and discipline.
- Risk-reward structure: Once confirmed by a breakout, the pattern usually leads to a sustained upward movement. Since entry usually occurs near the neckline with risk defined near support, the potential reward may outweigh the measured risk.
Merits and Demerits of the Double Bottom Candlestick Pattern
While the double bottom candlestick pattern offers structural clarity and measurable trade levels, its reliability depends upon confirmation, context, and prudent risk management.
| Merits | Demerits |
| Indicates a significant potential reversal of a prior downtrend, offering early participation in a possible upward move. | It may produce false breakouts, where price briefly moves above the neckline but fails to sustain momentum. |
| It establishes a clear support level at the two bottoms, aiding in disciplined risk management. | Its formation may take considerable time to develop, testing patience and capital efficiency. |
| It provides a defined entry point above the neckline, allowing structured trade planning. | It requires confirmation, and acting before a neckline breakout increases the risk of premature entry. |
| It reflects weakening selling pressure and strengthening buying interest, improving confidence in the setup. | The patterns are rarely perfect, and even slight variations may cause misinterpretation among less experienced traders. |
Conclusion
In conclusion, the double bottom pattern stands as a recognised reversal formation within classical technical analysis. When identified with patience and confirmed by a decisive breakout above the neckline, it offers structured entry, defined risk, and measurable objectives.
Yet, like all other chart patterns, it demands discipline and contextual judgment. Sound application lies not in rigid expectation, but in balanced interpretation supported by confirmation and risk management.