Crude oil technical analysis is the key to understanding one of the most actively traded commodities in global markets. It reflects a mix of demand expectations, geopolitical shifts, and trader positioning, all of which drive price behaviour across timeframes.
In the current market context, crude oil (WTI) technical analysis as of early May 2026 indicates a bullish medium-to-long-term trend, characterised by rising price channels and strong momentum. While daily, weekly, and monthly signals suggest buying, short-term volatility is high. This keeps traders attentive to price swings and near-term resistance levels.
Against this backdrop, combining chart patterns with indicators such as RSI and MACD allows you to interpret these shifting conditions. This approach not only helps in identifying potential trade setups but also supports more disciplined decision-making, enabling participants to navigate crude oil price movements with improved timing and risk control.
Crude Oil Technical Analysis
The overall crude oil trading rating stands at very bullish, suggesting that the dominant trend is positive despite recent price corrections. Here are some key takeaways:
- Current price trend: Crude oil is trading near USD 102.50 with a short-term decline of about 2.45%, indicating temporary weakness within a broader upward structure.
- Moving averages signal: All key moving averages from 5-day to 200-day are in bullish alignment, which confirms a strong underlying trend across short, medium, and long durations.
- Momentum indicators: Most indicators support the bullish view, with RSI around 56.82 and MACD in positive territory, reflecting steady upward momentum without extreme conditions.
- Indicator divergence: ROC shows a bearish reading, indicating that while the trend is positive, the pace of movement has slowed in the near term.
- Volatility insight: ATR suggests relatively controlled volatility, meaning price swings are present but not excessively unstable.
- Trend strength: ADX near 25.88 signals a developing strong trend, supporting continuation rather than reversal at this stage.
| Moving Average Crossover | ||
| Period | Crossover | Indication |
| Short-term | 5 and 20 DMA crossover | Bullish momentum |
| Medium-term | 20 and 50 DMA crossover | Bullish momentum |
| Long-term | 50 and 200 DMA crossover | Bullish momentum |
| Technical indicator snapshot | |||
| Indicator | Level | Signal | Interpretation |
| RSI (14) | 56.82 | Bullish | Momentum is positive but not overbought |
| MACD | 2.63 | Bullish | Trend continuation supported |
| Stochastic | 59.19 | Bullish | Stable upward bias |
| ROC | -8.53 | Bearish | Short-term slowdown |
| CCI | 59.89 | Bullish | Buying interest remains |
| Williams %R | -27.76 | Bullish | Price near stronger zone |
| ATR | 7.54 | Low volatility | Controlled price swings |
| ADX | 25.88 | Strong trend | Trend strength improving |
Crude oil price chart:
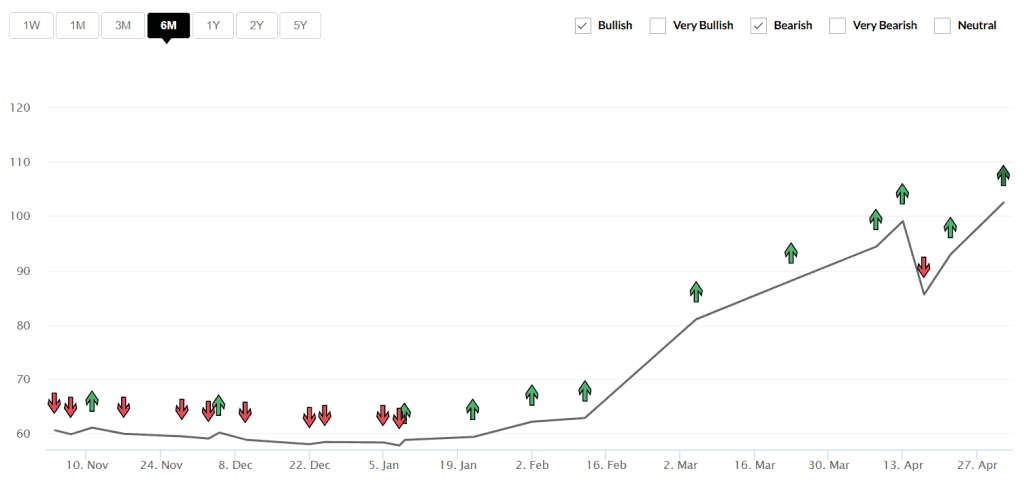
The 6-month historical chart shows a clear upward trend with the price forming higher peaks and troughs, which confirms a sustained bullish movement. A short pullback is visible on 17 April 2026, after a sharp rise, which appears to be a normal correction within an ongoing uptrend rather than a reversal.
The earlier phases showed mixed bearish signals, but recent weeks have been dominated by bullish indications, reflecting improving market confidence.
What drives Crude Oil Prices in the Market?
Here are some major factors based on which crude oil prices move in the market:
- Supply and Demand Equilibrium:
Crude oil prices usually move higher when demand is stronger than supply, and soften when supply outweighs demand. The recent data shows tightening conditions, with around 8.2 billion barrels of global inventories cushioning supply disruptions, but declining reserves are now pushing demand pressure higher. This shift is expected to support crude oil prices even amid short-term volatility.
- OPEC+ Decisions:
The Organisation of Petroleum Exporting Countries and its allies influence global supply through coordinated production moves. A major shift has emerged with the UAE announcing its exit from OPEC and OPEC+, effective 1 May 2026, with plans to raise capacity to 5 million barrels per day by 2027, signalling potential supply expansion and shifting market expectations.
- Geopolitical Instability:
Conflicts in oil-producing regions or sanctions can reduce supply, causing price spikes. In 2026, the tensions linked to the US–Iran conflict led to disruptions in the Strait of Hormuz, significantly limiting flows and driving price swings and risk premiums in crude oil.
Best Indicators for Crude Oil Technical Analysis
Here are some tools and indicators that help in reading trend, momentum, and volatility of crude oil prices in commodity trading.
- Moving Averages (MA/EMA): The moving averages identify the underlying trend in crude oil prices. The price above key averages indicates an uptrend, while trading below them suggests a downtrend.
- Relative Strength Index (RSI): The RSI measures crude oil momentum on a 0–100 scale. The above 70 indicates reading indicates overbought levels, while below 30 signals oversold levels and potential reversals.
- Bollinger Bands (20,2): The Bollinger Bands track volatility. The prices near or beyond bands indicate overbought or oversold conditions and possible breakout or reversal zones.
- Moving Average Convergence Divergence (MACD): It tracks the changes in price trend. An upward MACD crossover suggests growing buying pressure, while a downward crossover indicates that momentum is starting to slow.
- Volume and Support/Resistance: The volume confirms the strength of a price move, while support and resistance levels define important zones for entry and exit. These levels define entry and exit zones, often based on pivots, Fibonacci levels, or previous highs and lows.
Popular Crude Oil Chart Patterns Traders Watch
The crude oil traders track patterns such as cup and handle, head and shoulders, and double tops or bottoms, along with pennants and wedges, to anticipate breakouts, reversals, and trend continuation.
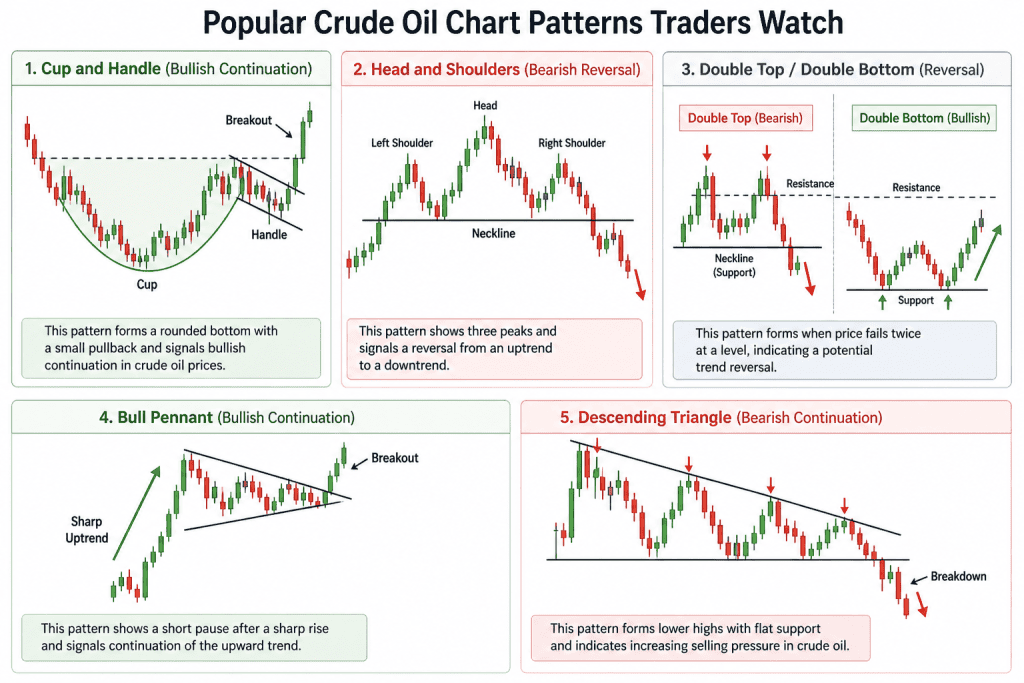
| Pattern | Description |
| Cup and Handle | This pattern forms a rounded bottom with a small pullback and signals bullish continuation in crude oil prices. |
| Head and Shoulders | It consist of three peaks, marks the end of an uptrend and the start of a downward movement. |
| Double Top / Bottom | This pattern forms when price fails twice at a level, indicating a potential trend reversal. |
| Bull Pennant | This pattern shows a short pause after a sharp rise and signals continuation of the upward trend. |
| Descending Triangle | This pattern forms lower highs with flat support and indicates increasing selling pressure in crude oil. |
Trading Strategies Based on Crude Oil Technical Analysis
Crude oil trading strategies involve using price movement, technical indicators, and proper risk control to identify and manage trading opportunities. While there is no single method that works consistently, disciplined execution is essential in volatile markets.
- Trend following strategy: This approach focuses on taking trades in line with the current crude oil trend to improve the chances of success.
- Breakout trading strategy: This approach focuses on entering trades when crude oil prices break resistance or support levels. The strong volume often confirms the validity of the breakout.
- Pullback trading strategy: Here, the traders wait for temporary price corrections within a trend and enter near support levels. This allows better entry prices while aligning with the overall trend direction.
- Range trading strategy: When crude oil prices move within a fixed band, traders look to buy near support and exit near resistance, benefiting from repeated price swings.
Common Mistakes in Crude Oil Trading (and How to Avoid Them)
Even small errors in crude oil trading can lead to large losses. Here is what you need to know:
- Ignoring the trend: Traders might enter positions against the ongoing crude oil trend, which increases risk. Aligning trades with the overall trend improves probability and consistency.
- Overtrading: Entering multiple trades in volatile conditions often leads to poor decision-making. Focusing only on high-quality setups helps maintain discipline and better results.
- Neglecting stop-loss: Without a stop-loss, losses can quickly expand during sharp crude oil movements. Setting predefined exit levels helps protect capital and control risk.
- Ignoring news impact: Crude oil prices react significantly to geopolitical and economic events. Considering both technical and fundamental factors improves decision-making.
How Beginners Can Practice Crude Oil Analysis Risk-Free
Beginners can practise crude oil analysis using demo accounts with real-time data, allowing strategy testing and learning without risking actual capital. Here is a step-by-step guide:
| Step–1 | Set up a demo account: | Choose a regulated broker and open a demo account with virtual funds. |
| Step–2 | Use trading platforms: | Practise on platforms for real-time charts. |
| Step–3 | Learn basic indicators: | Study moving averages, RSI, and support–resistance to understand price behaviour. |
| Step–4 | Track market drivers: | Observe inventory reports, OPEC+ decisions, and geopolitical news impacting crude oil. |
| Step–5 | Apply risk rules: | Risk only a small portion per trade and always use stop-loss levels. |
| Step–6 | Record trades: | Maintain a journal to track decisions, mistakes, and improvements over time. |
| Step–7 | Move to live trading: | Start small with mini contracts after consistent demo performance. |
Final Thoughts
Crude oil technical analysis becomes far more manageable when you keep things simple. Focus on the trend, watch key levels, and use indicators only for confirmation, not confusion. The market will always move, but every move does not need to be traded.
Most mistakes come from rushing entries or ignoring risk. If you stay patient, follow a clear plan, and protect your capital, consistency naturally improves over time.
FAQ‘s
Crude oil can be suitable for beginners, but it requires careful learning due to its volatility. The new traders should begin with demo accounts, understand basic technical indicators, and practise risk management. It is suggested to start small and focus on discipline that would help to build confidence before committing real capital.
The tools such as RSI, MACD, and moving averages are commonly used together to analyse momentum and trends. Combining multiple indicators with support and resistance levels improves accuracy and helps traders make more informed decisions.
Yes, beginners can practise crude oil trading without using real money through demo accounts offered by brokers. These platforms provide real-time market data and virtual funds, allowing users to test strategies, understand price movements, and build trading skills in a risk-free environment.