Every second counts in intraday trading, and so does every decision. With over 300% more traders crowding the market between FY 19 and FY 23, the edge lies in using smarter tools. One such tool is the RSI Strategy for Intraday Trading, a method that helps spot overbought and oversold conditions. In this blog, we’ll get into its details and how it helps trade better.
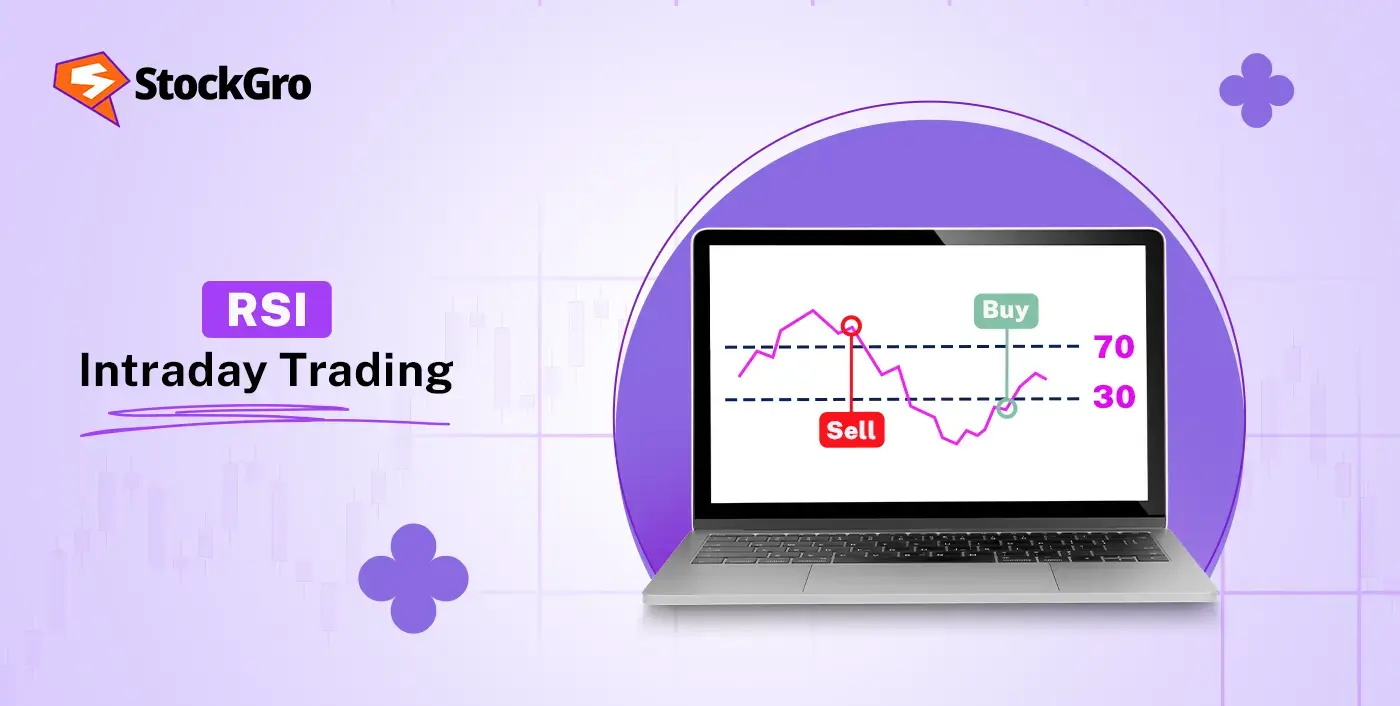
What is the RSI Indicator?
The Relative Strength Index (RSI) is a common momentum-based indicator in technical analysis. It measures the strength and speed of recent price changes to help traders understand market momentum. RSI values range from 0 to 100. As one of the widely followed intraday indicators, RSI is often used to observe short-term market signals within intraday trading setups.
How RSI Works for Intraday Trading
The Relative Strength Index (RSI) is a momentum indicator used in intraday trading to spot when a stock might be overbought or oversold. It moves on a scale from 0 to 100.
RSI looks at how much a stock has gone up or down over a set number of periods usually 14, but shorter timeframes like 5 or 9 are often used in intraday trading to capture quicker moves.
When RSI goes up, it means recent gains are stronger than losses, showing buying pressure. When it drops, losses are bigger than gains, signaling selling pressure. Intraday traders use this to read short-term market sentiment and possible quick reversals, helping them make fast decisions during the day.
How to Read RSI Signals in Intraday
Reading the RSI strategy for intraday trading is more about how it behaves with price than just watching fixed levels. The Relative Strength Index shows momentum shifts, and its real-time movements can reveal when strength is rising or fading.
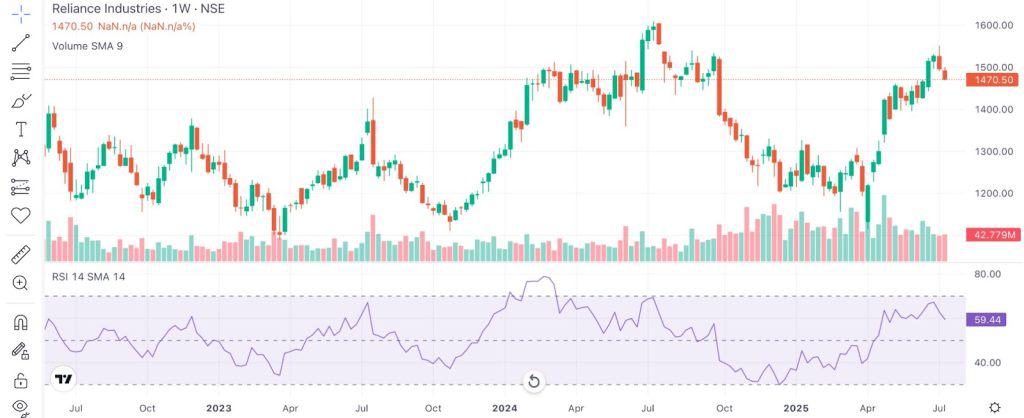
Let’s say you’re watching XYZ Ltd. on a 15-minute chart, with RSI set to 9 periods to capture quick moves. Between 10:15 AM and 10:45 AM, the price climbs from ₹172 to ₹176, and RSI rises steadily from 58 to 71. This alignment between price and RSI indicates strong buying interest. But soon after, while the price nudges up to ₹177, the RSI flattens near 72 instead of continuing upward. A few candles later, RSI starts dipping to 68 even though the price hasn’t fallen yet. A similar trend RSI shifting pattern has been shown in the chart below.
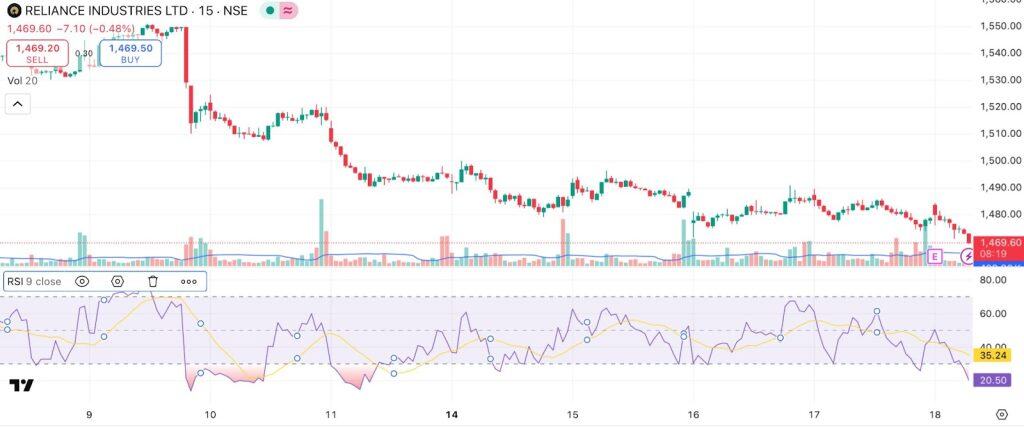
This signals slowing momentum. The trend may still hold, but the force behind it is fading. Traders often look beyond level crossings, watching how RSI and price move together. A divergence or sharp RSI swing may hint at a possible reversal, offering early insight into changing sentiment before price visibly reacts.
Overbought & Oversold Zones for RSI
The Relative Strength Index (RSI) moves between 0 and 100 to reflect the strength of recent price moves. An RSI reading above 70 often means the stock may have moved up quickly and could be due for a pause or pullback. When it falls below 30, it’s seen as oversold, indicating the price might be under pressure and could recover.
Let’s say you purchase 100 shares of ABC Ltd. at ₹900. The price climbs to ₹1100, and RSI crosses 80, showing strong buying pressure, but also warning that the stock may be overextended. Later, the price falls to ₹880 and RSI drops below 30, pointing to heavy selling that may be nearing a pause.
RSI Trading Strategies for Intraday
RSI can be paired with other tools to identify potential intraday setups.
- Divergence: When price reaches a new high or low but RSI doesn’t, it can suggest that momentum is fading and a reversal might be near.
- Trend Confirmation: In a strong trend, RSI staying above or below certain levels can help confirm the direction and strength of the move.
- Bounce Plays: During trends, RSI entering overbought or oversold zones can signal a short-term pullback followed by a continuation.
- Breakouts: RSI breaking out of its own range may signal price is preparing for a breakout.
RSI + Moving Average Setup
This approach combines RSI’s momentum signals with the direction-based input from Moving Averages (MAs). When RSI enters overbought or oversold territory, the MA helps confirm if the trend supports that signal.
For example, during an uptrend, if RSI drops to oversold levels near a key MA (like the 20-period MA) and then starts rising, it may suggest a potential buying opportunity. On the contrary, if RSI is high and the price drops below the moving average, it might hint that the trend is losing strength. The MA helps filter out unclear signals in choppy markets.
RSI + VWAP Setup
Volume Weighted Average Price(VWAP) reflects the average price of a stock throughout the day, giving more weight to high-volume trades. When used with RSI, it gives a more balanced view that considers both price and how much volume is behind it.
If the price is above VWAP and RSI shows upward momentum such as rising from oversold, it may support a bullish view. If the price is below VWAP and RSI is turning down from overbought, it might suggest bearish strength. This setup helps confirm if a price move has strong backing from both buyers or sellers.
RSI + Support/Resistance
Support and resistance are price levels where buying or selling has previously shown up. When RSI is used along with these levels, it can add more context to what the indicator is showing.
If the price is near a known support and RSI is in the oversold zone, it may suggest a bounce. If the price is close to a resistance level and RSI shows overbought conditions, it might signal that a reversal could be near.
This approach helps match momentum with core price levels, which can make signals more reliable.
Common RSI Trading Mistakes
Several common missteps can reduce the effectiveness of the RSI strategy in intraday trading:
- Ignoring the Trend: Using RSI to bet against strong trends (e.g., shorting in an uptrend) can lead to poor trades.
- No Confirmation: Relying only on RSI without checking price action or other tools can be risky.
- Wrong Timeframe: Applying RSI settings meant for longer timeframes to quick intraday charts may result in weak signals.
- Over-reliance: Treating RSI as a complete system on its own can be misleading.
- Not Adapting to Volatility: During high volatility, RSI can remain overbought or oversold for long periods.
Advantages of Using RSI
RSI remains a widely used indicator in intraday trading for good reason. Here are some of its key benefits:
- It tracks how quickly prices are changing, offering a view of current market strength.
- Helps locate points where a price trend might reverse.
- Can warn when the current trend may be weakening.
- Works across different asset types and timeframes.
- RSI is relatively easy to read and understand.
- Sometimes, RSI can signal a shift in trend even before the price reacts.
Limitations of RSI
While useful, RSI has its drawbacks that traders should consider:
- Weak in Strong Trends: RSI can stay overbought or oversold for long periods when trends are strong, giving early or false signals.
- Based on Past Data: RSI reflects past price movements, so it may lag behind real-time action.
- Not a Complete Tool: It works best when combined with other indicators or patterns.
- Sensitive to Settings: Different period settings can change RSI behavior significantly.
- Subjective Interpretation: Signals like divergence can vary from trader to trader.
- False Alerts in Sideways Markets: In choppy price action, RSI may give frequent, unreliable signals.
Conclusion
The RSI strategy for intraday trading offers a structured way to interpret momentum and potential price shifts during the trading day. While not foolproof, combining RSI with tools like moving averages, VWAP, or support and resistance can help build context. Used thoughtfully, RSI remains one of the more practical indicators for intraday setups and signal evaluation.
FAQ
RSI strategy for intraday trading involves using the Relative Strength Index to spot overbought and oversold conditions on short timeframes (e.g., 5–15 minutes). Traders often buy when RSI falls below 30 and turns upward, and sell when RSI rises above 70 and turns downward, confirming signals with price action or trend indicators to reduce false entries.
There is no definitive consensus on whether RSI is better when combined with a Moving Average or VWAP for all scenarios; both combinations are popular. Pairing RSI with a Moving Average can help confirm trend direction and filter signals, while using VWAP provides insights into average traded prices and intraday price levels. Choice often depends on the asset, trading timeframe, and personal strategy preferences.
Combining RSI with a Moving Average crossover typically adds a layer of confirmation that may help reduce false signals from either tool used alone. The overall accuracy varies by market conditions and the chosen parameters but using them together enables more comprehensive analysis of momentum and trend changes. However, no method guarantees precision and traders should evaluate performance for their markets.
Relying solely on RSI for trading often increases risk, as it can produce numerous false signals, particularly in strong trending markets where overbought or oversold levels can persist. Most traders combine RSI with other tools, such as Moving Averages, support and resistance zones, or volume indicators, to strengthen their analyses and decision-making processes. Using RSI as part of a broader technical framework is generally considered to reduce errors and improve consistency.
It’s generally considered beneficial for beginners to use RSI alongside other technical indicators like Moving Averages or VWAP, as this combination may improve the reliability of trade signals. Employing multiple indicators offers a broader perspective on price movement and momentum, helping newer traders avoid common pitfalls like acting on isolated or misleading signals. This approach promotes more informed and disciplined trading decisions during the learning phase.
Buy when RSI rises from 30 in an uptrend, and sell when it drops from 70 in a downtrend. Always confirm with VWAP or support/resistance to avoid false signals.
For intraday, RSI 14 is the most reliable. Use RSI 7–9 if you want faster, more aggressive signals.